Explore the examples in Demo by chart type. Switch between tile and table views, or open an image to see its description and complete list of tags.
233 examples in 15 categories
Dashboards & Multi-Chart Views10 examples
| Example | Description of example | Tags |
|---|---|---|
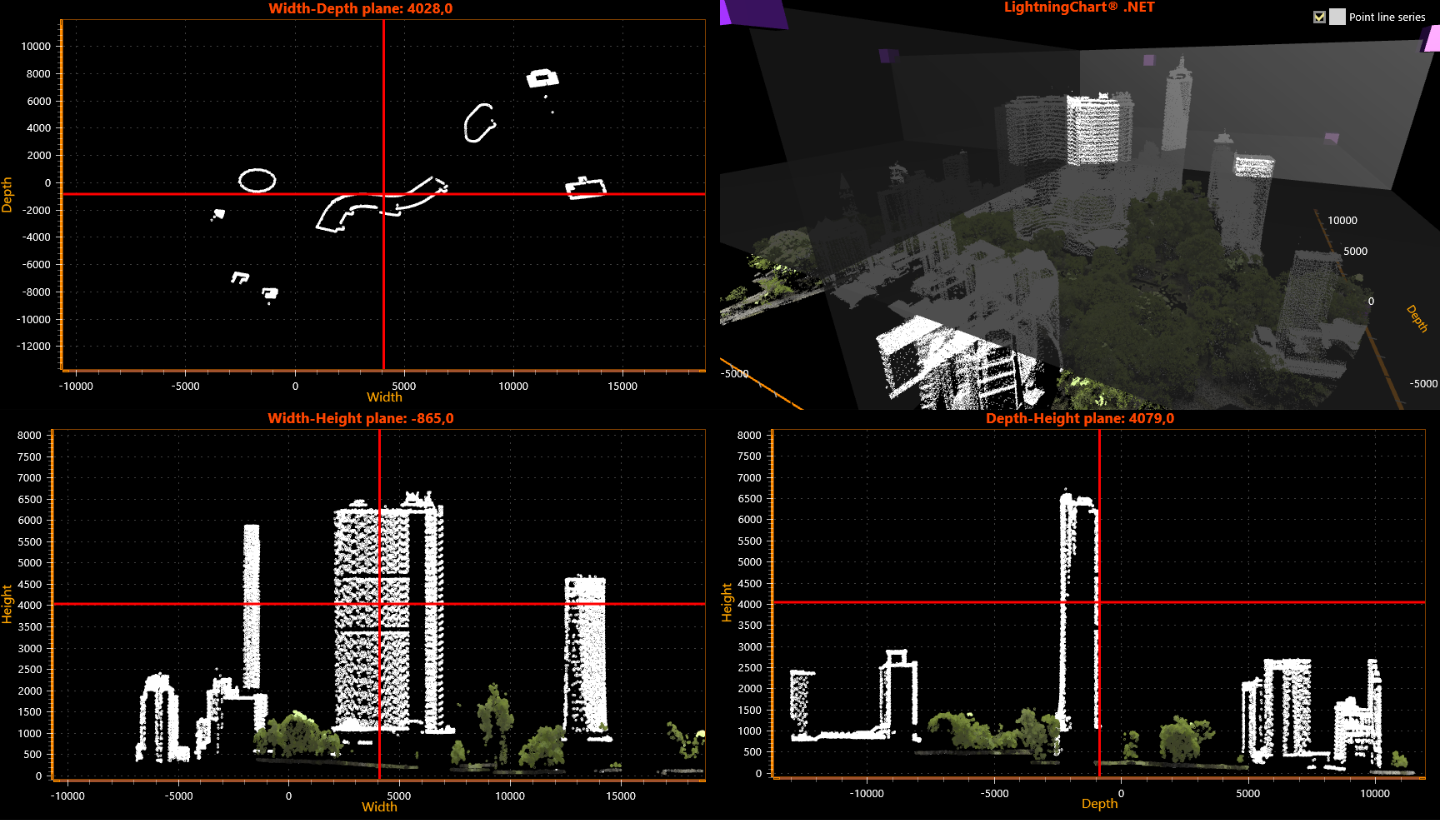 3DSlicer 3DSlicer | Example of interactive slicing of 3D chart with planes. Synchronous update of 2D and 3D charts, when planes-3D or vertical/horizontal-line-2D is dragged. XY charts show points on the corresponding 3D plane. | AdvancedShowcase3DViewXY2DSlicerSyncLidarSurfaceMeshSeries3DPointLineSeries3DConstantLinesLineSeriesCursorsFreeformPointLineSeriesIndividualPointColoringEventCloudXYZ |
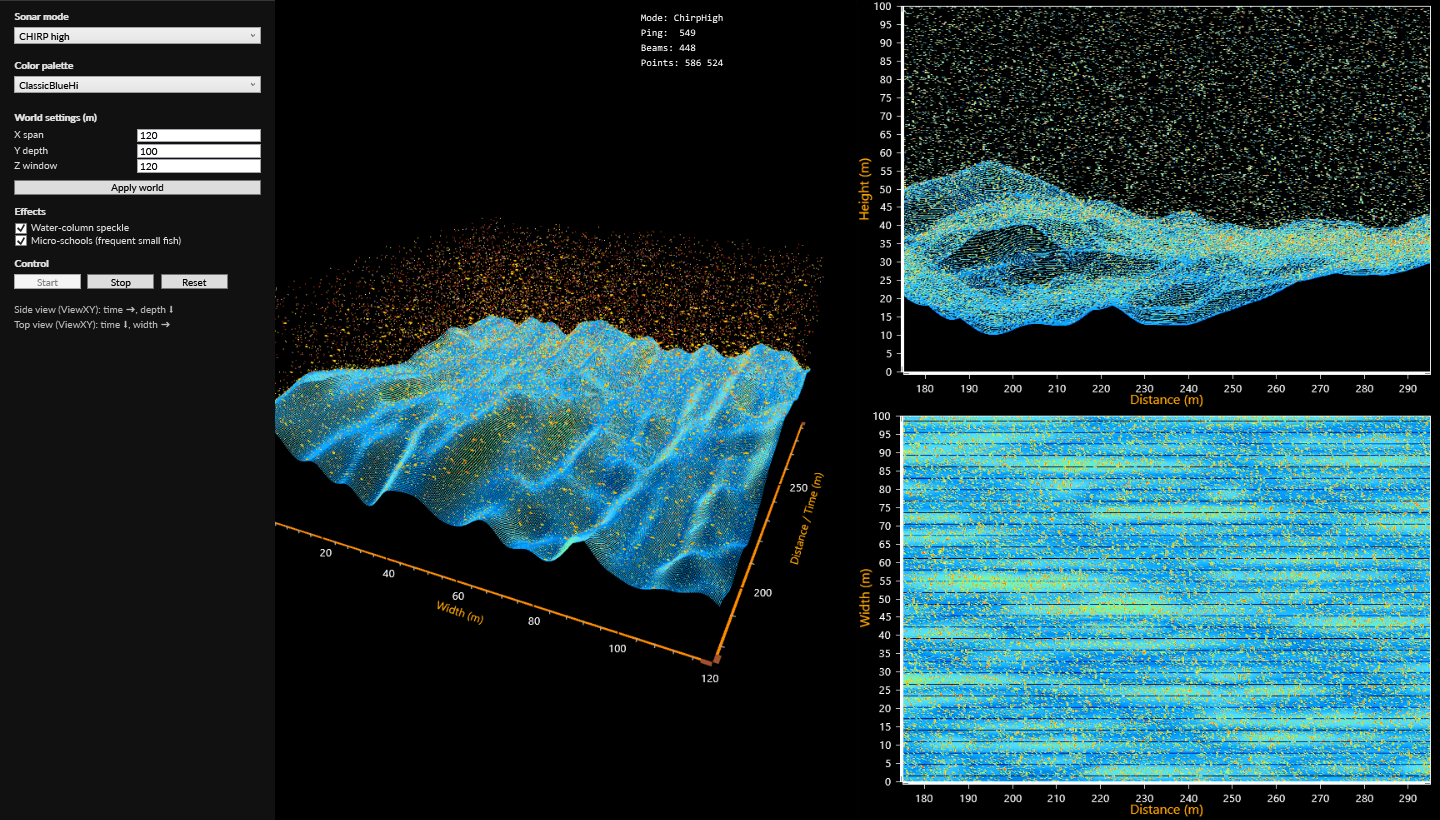 3DSonar 3DSonar | Example of interactive 3D sonar. Synchronous update of 2D and 3D charts. Sonar Mode and Effects is applied only for new real-time data. Color palette is applied for 3D new data, but instantaneously in XY charts. | AdvancedShowcasePerformance3DViewXY2DSyncSonarPointLineSeries3DIndividualPointColorsIntensityGridSeriesValueRangePaletteCloudDataCursorMultithreadingPointsCompactColoredCompactPointsColorShape2DConcurrentQueueXYZNewAdded |
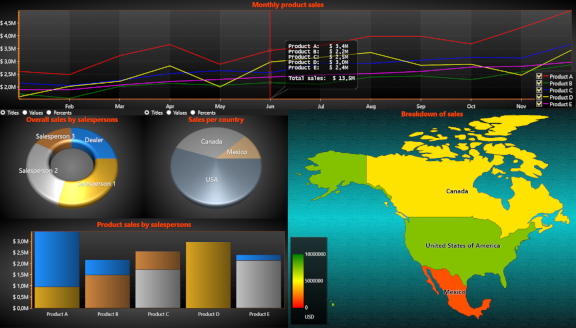 BusinessDashboard BusinessDashboard | Business dashboard example. Move monthly product sales chart's cursor line to bring up a sales information box and to update other charts. | 2DView3DMapXYZViewXYCartesianBarsPieLineDashboardMarketingSalesBusinessCursorAnnotationStatisticShowcase |
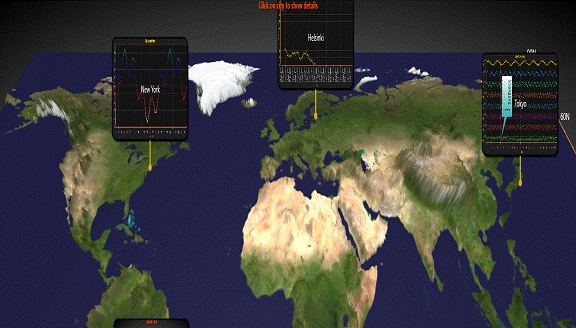 ChartsInChart ChartsInChart | Chart thumbnails can be clicked to select more detailed chart below. | 2DView3DCartesianXYZViewXYInsideCaptureThumbnail |
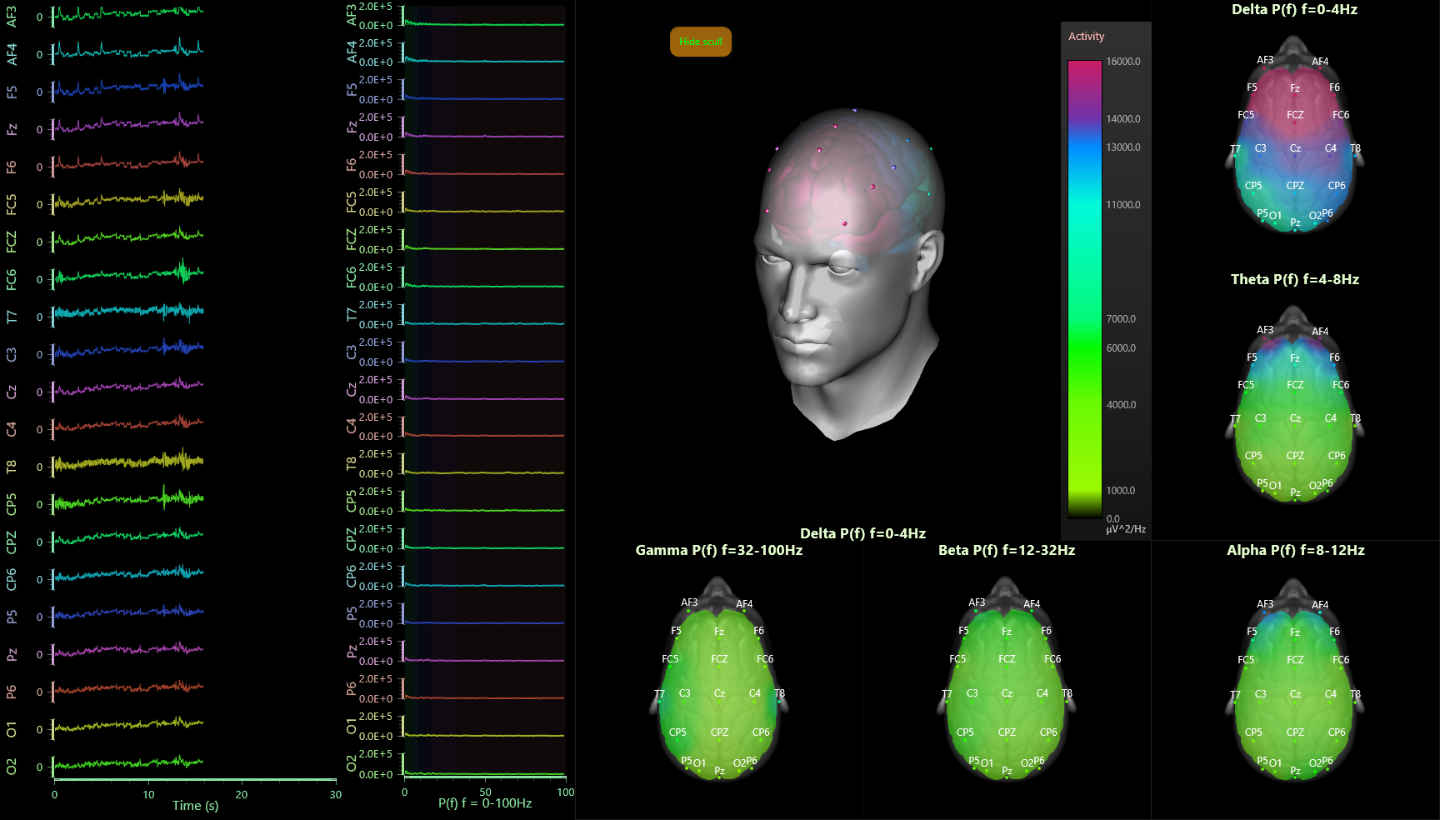 EEGDataVisualizationShowcase EEGDataVisualizationShowcase | 21 channels 1khz rate EEG data visualization. Example of EEG monitoring application. Realtime EEG data scrolling, with power spectral density estimate. The distribution of spectral density in real time on brain surface is shown. | AdvancedShowcasePerformance2DView3DViewXYRealtimeStreamingScrollingMeshModelsAreaSeriesBandHeatmapIntensityGridSeriesFromSurfacePointsSampleDataBlockSeriesMarkersDataCursorPointLineSeries3DAnnotationSignalProcessingSpectrumCalculatorStencilStencilAreaEEGLFPFFTPSDDeltaThetaAlphaBetaGamma |
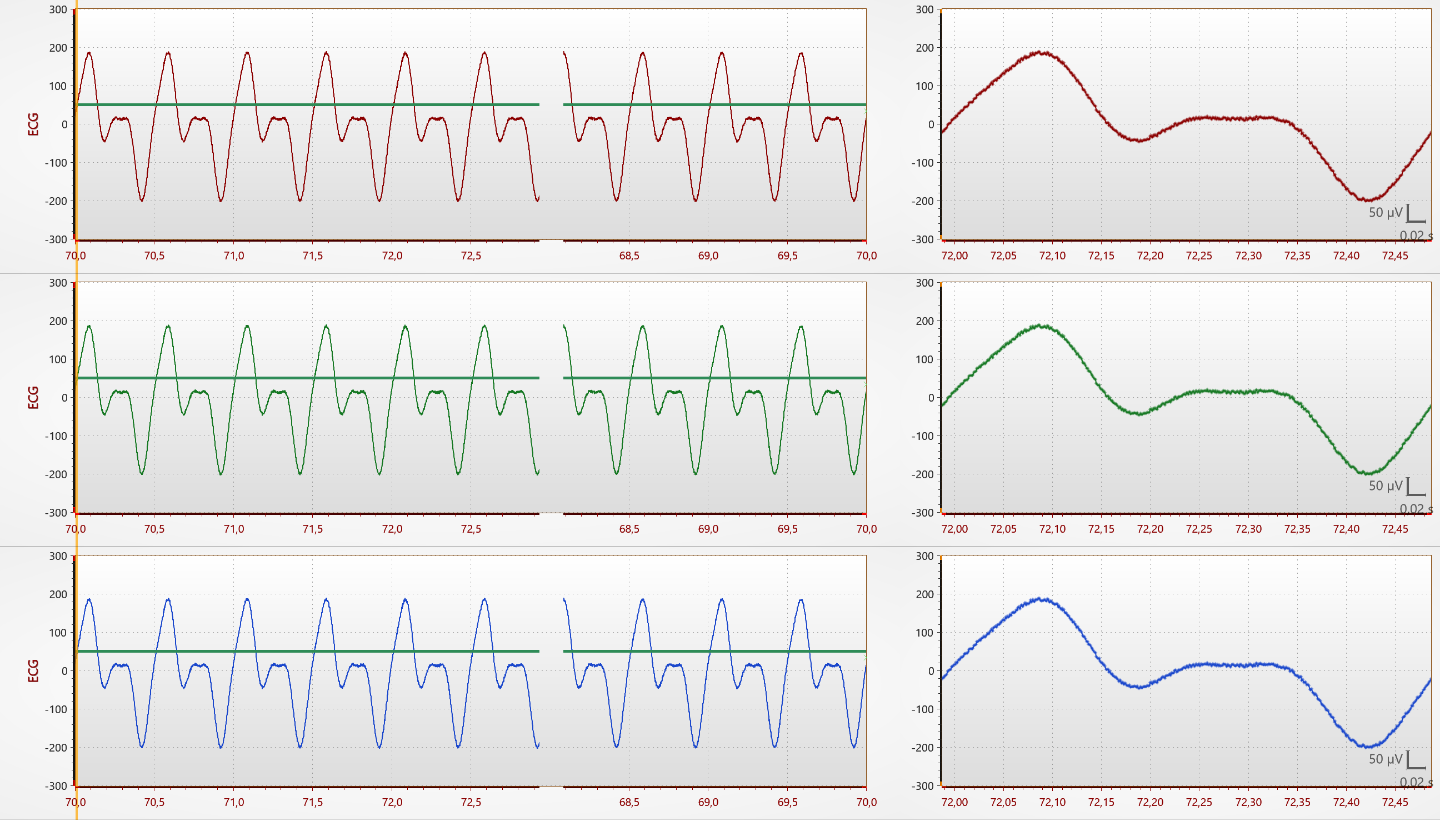 MultiChartsXY MultiChartsXY | Multiple charts used as medical ECG monitor (not real ECG signal) Stop signal generator to enter data review. Drag line series from chart to another, drop above target X or Y axis. | Advanced2DViewXYLineRealtimeStreamingSampleSamplingPointLineSeriesLineSeriesCursorConstantLineYAxesLayoutStackedUnitsMiniScaleEcgMultiChannelSignalGeneratorCartesianMVVM |
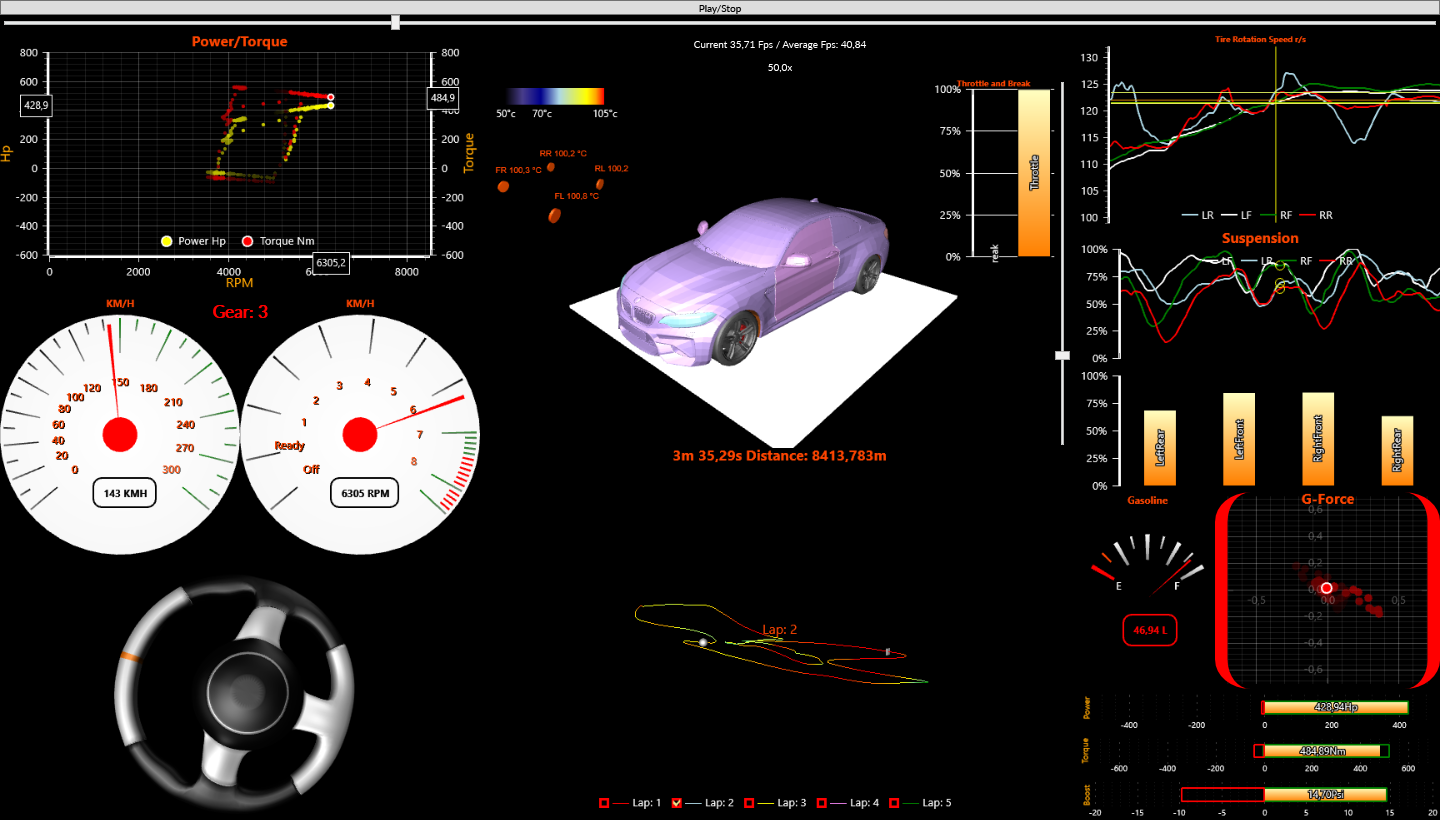 RaceCarTelemetry RaceCarTelemetry | Race car telemetry example, shows preprocessed race car telemetry as dashboard (for multiple chart types) in real time. | AdvancedShowcasePerformance2D3DPolarDashboardTelemetryRaceCarRPMTorquePsiLineScatterMeshModelMarkerTrackingLineSeriesCursorAnnotationPointLineSeriesPointLineSeries3DBarSeriesSectorPersistentSeriesRenderingLayerValueRangePaletteViewXYView3DViewPolarMotorsport |
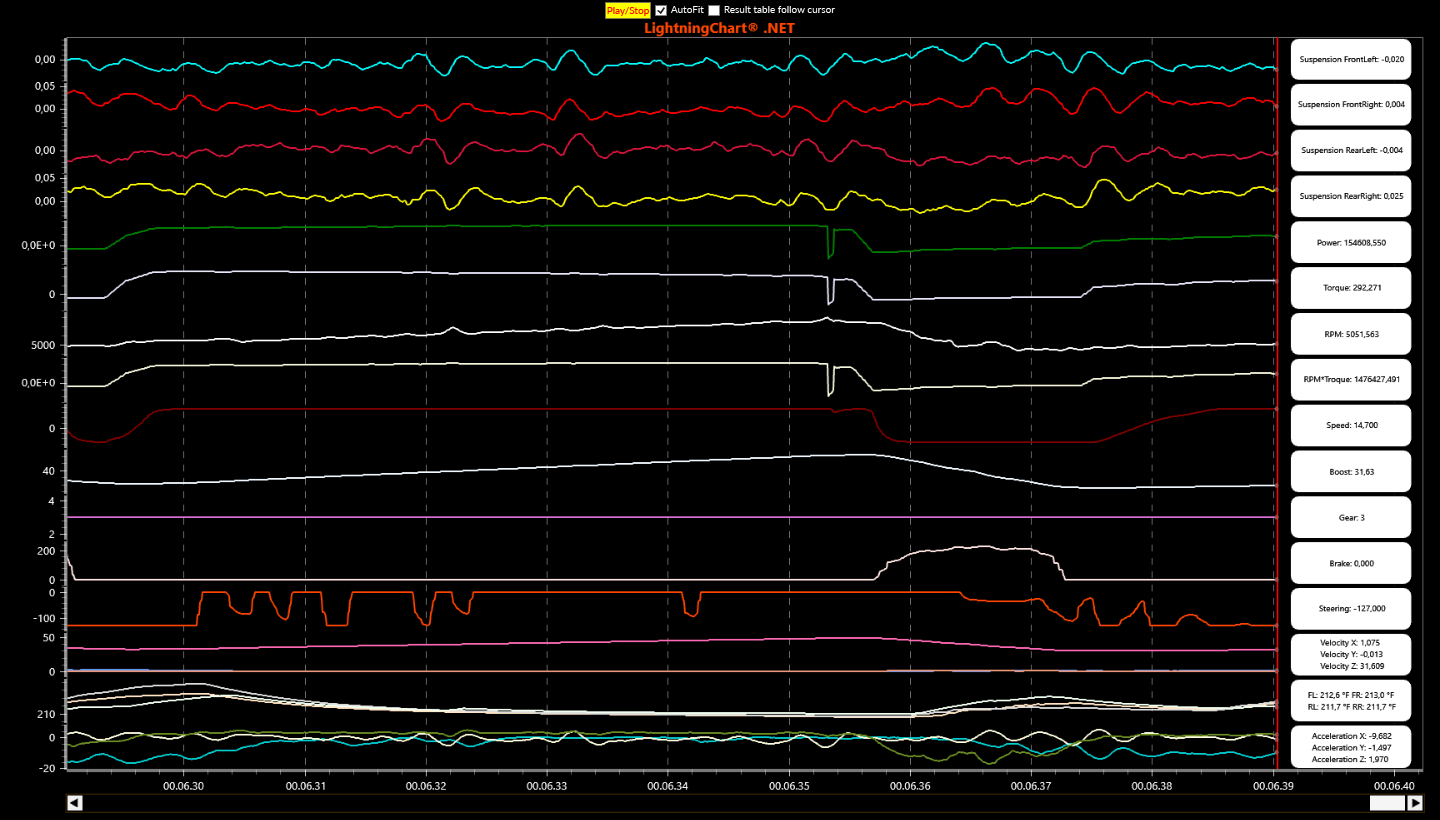 RaceCarTelemetry2 RaceCarTelemetry2 | Race car telemetry example, showing preprocessed race car telemetry in real-time XY line-chart. | Advanced2DViewXYLineChartStreamingRealtimeScrollingRaceCarRPMTorquePsiLiteLineSeriesAnnotationLineSeriesCursorScrollBarHorizontalScrollBarAutoYFitMotorsportTrackingTelemetryYAxesLayoutStacked |
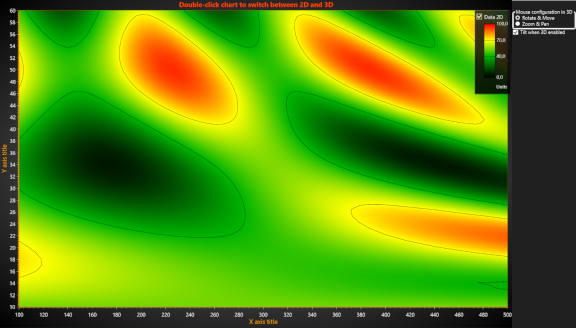 Switch3Dto2D Switch3Dto2D | Example shows how to switch 2D plot with data to 3D. | 2DView3DViewXYHeatmapSurfaceSwitchIntensityGridSeriesSurfaceGridSeries3DPaletteMVVM |
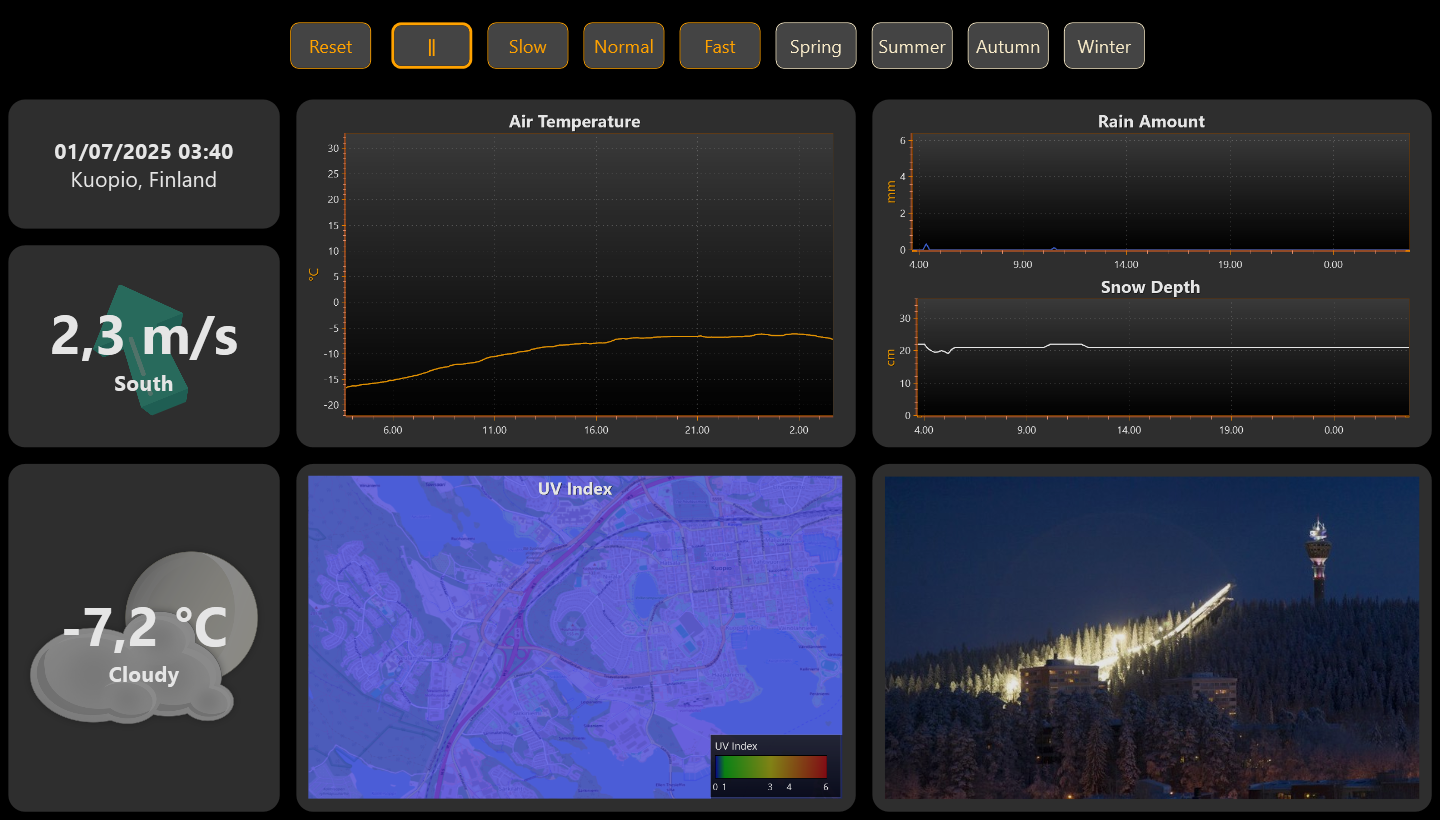 WeatherDashboard WeatherDashboard | Weather measurements visualization example, shows historical weather data of Savilahti, Kuopio, Finland in multiple charts. The data covers the period from January 1st to October 10th, 2025. The visualization is accelerated since the data was recorded at 10-minute intervals. | DashboardLineHeatmapPointLineSeriesIntensityGridSeriesValueRangePaletteViewXYWeatherMapBackgroundNewAdded |
Line & Area Charts39 examples
| Example | Description of example | Tags |
|---|---|---|
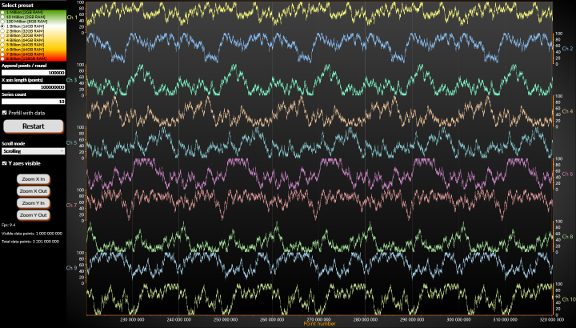 8BillionPoints 8BillionPoints | Scrolling line plot of 8 BILLION (8,000,000,000) data points. | 2D8BillionViewXYLineRealtimeStreamingEkgEcgEegStackSegmentsScrollingSweepingShowcasePerformanceSampleDataBlockSeriesMultiYAxis |
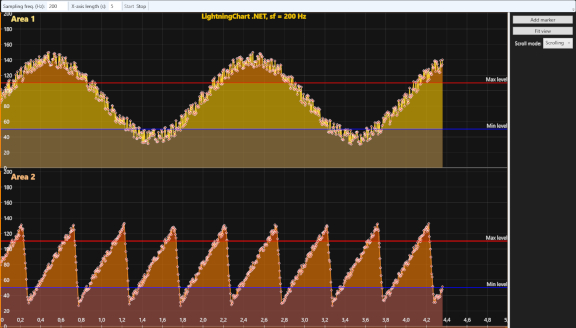 AreaSeriesRealTimeXY AreaSeriesRealTimeXY | This example shows you real-time measurement monitor with area series. | 2DViewXYCartesianRealtimestreamingAreaScrollingMarker |
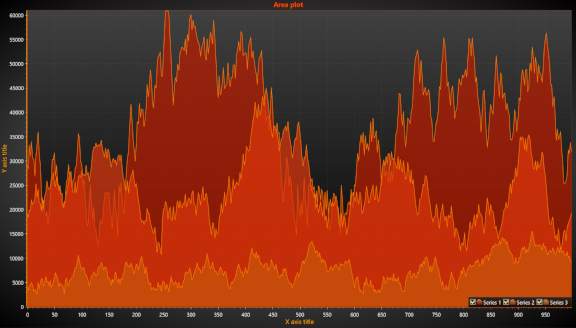 AreaXY AreaXY | Simple area series example. | 2DBasicsViewXYCartesianAreaMountainFillOverlapDataCursorMVVM |
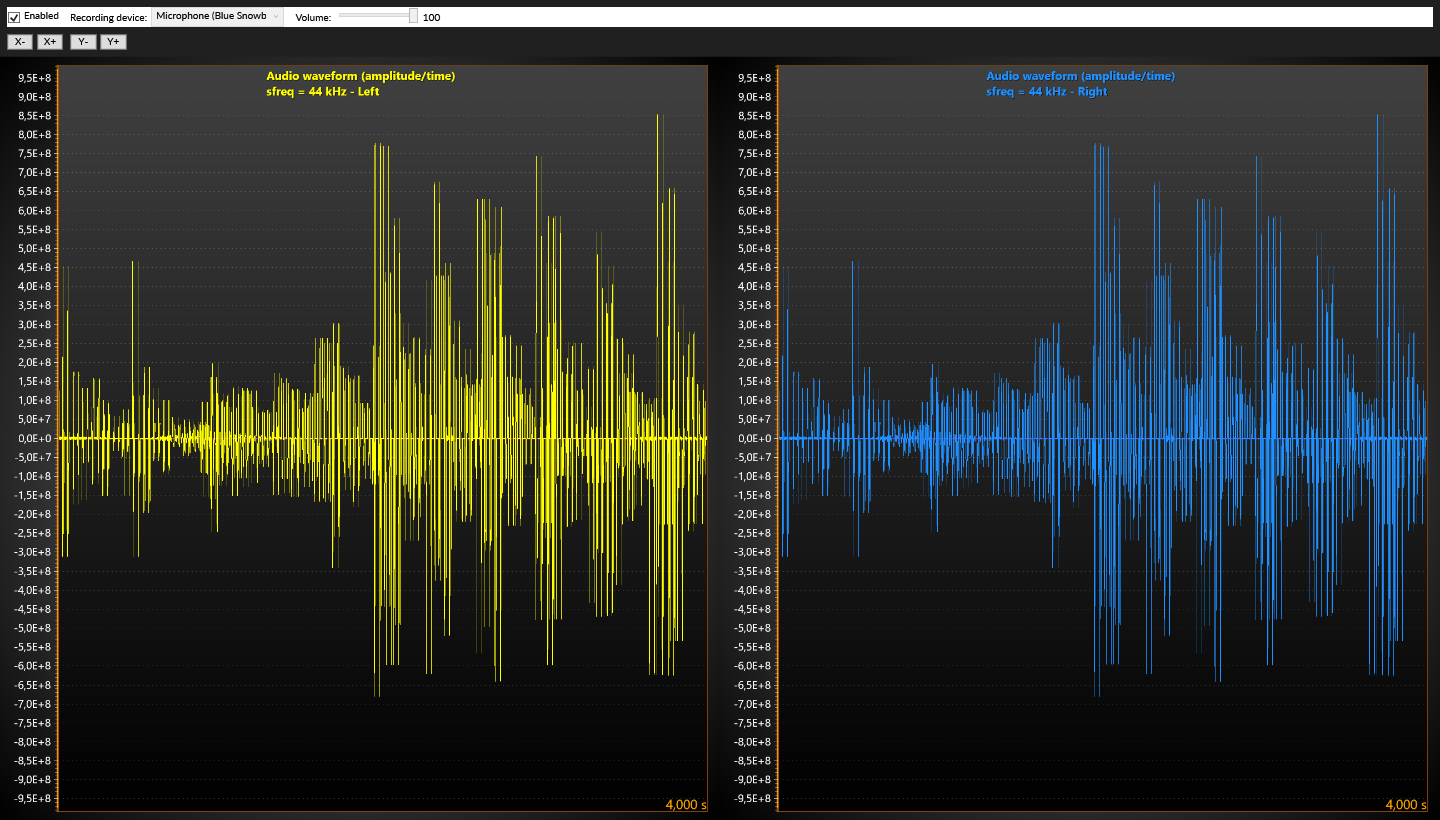 AudioInput AudioInput | AudioInput component is used to input waveform data from a sound device, such as mic-in or line-in. The real-time waveform data is plotted in waveform graphs. | 2DViewXYCartesianSignalreaderSignaltoolsLineScrollingWaveformAudioInputMic-in |
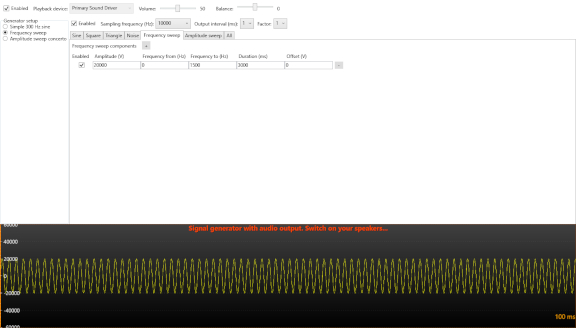 AudioOutputSignalGenerator AudioOutputSignalGenerator | SignalGenerator component is used to generate live data stream. The stream is forwarded to the chart for visualization and for AudioOutput component for audible sound through speakers. | 2DViewXYCartesianAudioOutputSpeakersSignaltoolsSignalgeneratorGeneratorSynthesizingLine |
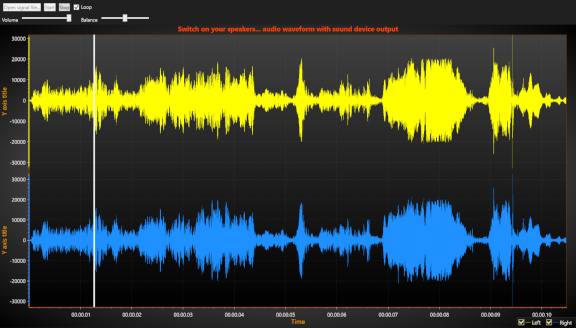 AudioOutputSignalReader AudioOutputSignalReader | SignalReader component is used to read data from a file, to generate a playback. The data is forwarded to AudioOutput component for audible sound through speakers. The chart displays the waveform with a indicator of current playback position. | 2DViewXYCartesianAudioOutputSpeakersSignaltoolsSignalreaderLine |
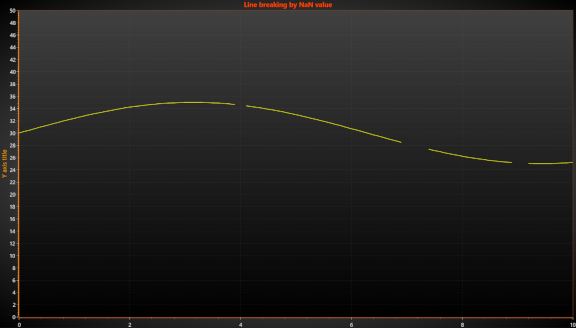 BreakingLineByNaN BreakingLineByNaN | DataBreaking options can be used to define which value must break the data. | 2DViewXYCartesianBreakLineNaNMVVM |
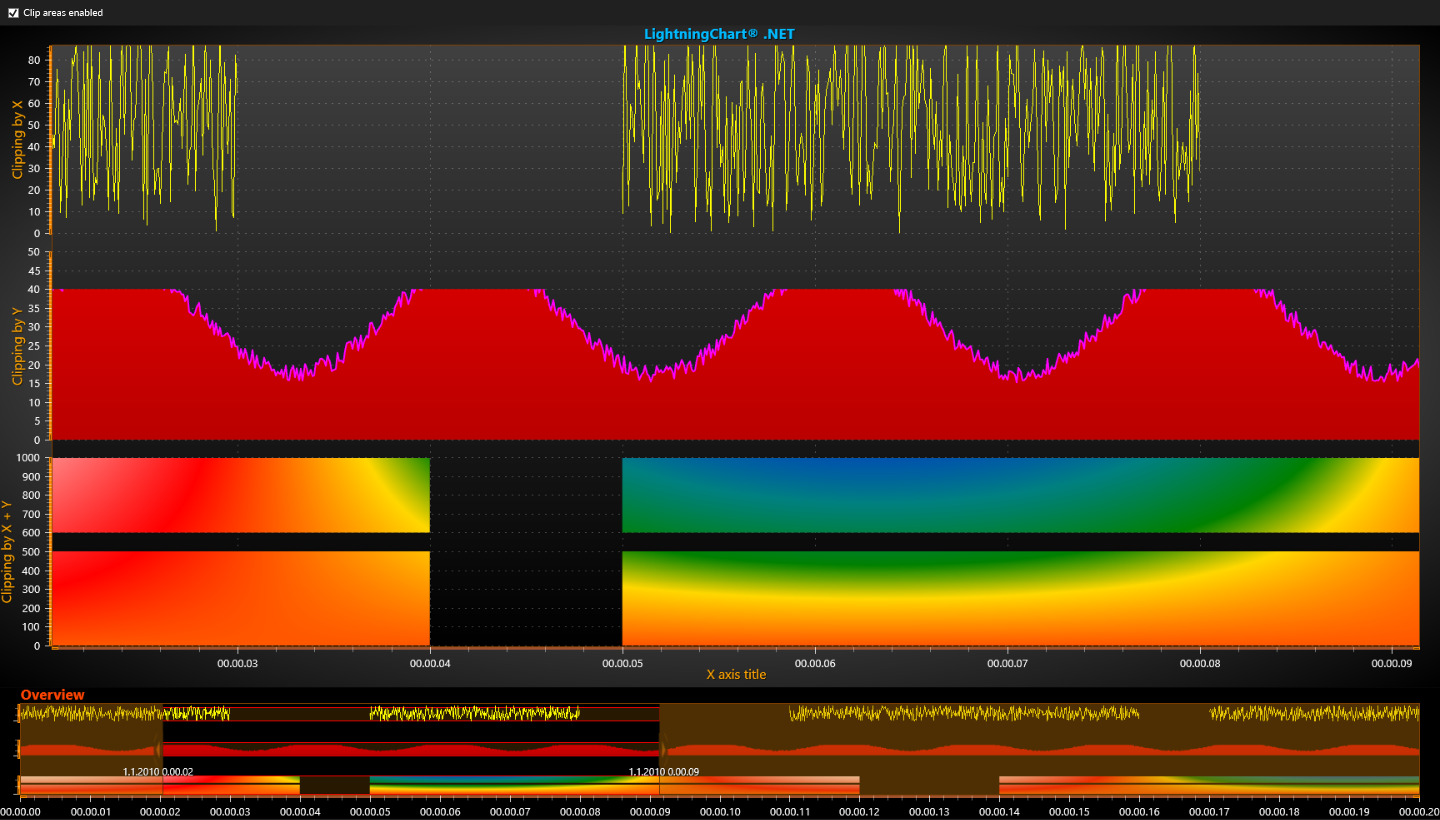 ClipAreas ClipAreas | This example shows you these areas can be used to filter out segments of series, for example ranges of invalid values. | 2DViewXYCartesianClipAreaRangePreventMaskStencilLineAreaHeatmapIntensityStackZoomBarMVVM |
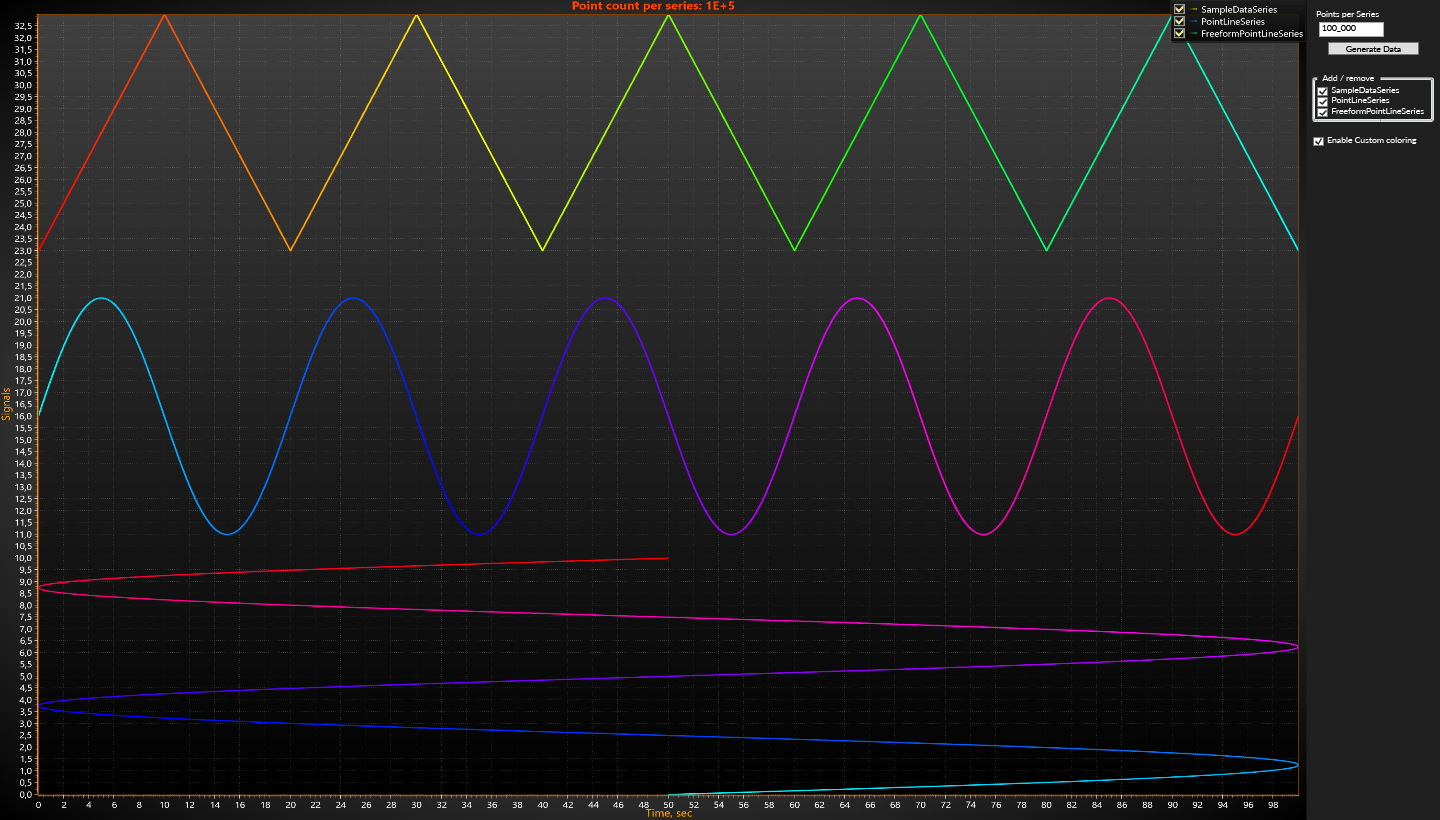 CustomColoringLineXY CustomColoringLineXY | Example shows how CustomLinePointColoringAndShaping event can be used to add custom colors for SampleDataSeries, PointLineSeries and FreeformPointLineSeries. Note, that FreeformPointLineSeries is slowest to update, therefore, if shown together overall performance will be limited by FreeformPointLineSeries. | ViewXYCustomCustomLinePointColoringAndShapingSampleDataSeriesPointLineSeriesFreeformPointLineSeriesIndividualPointColoringEventHasDataPointIndicesDataPointIndicesPointColor2DNewAdded |
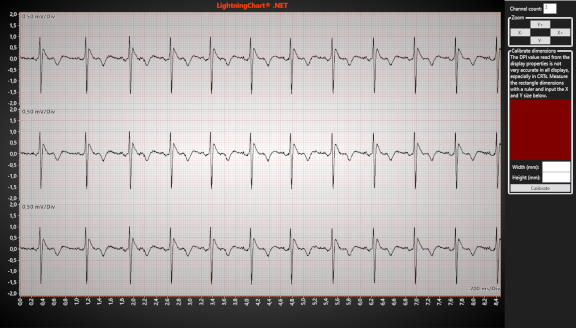 ECGPaperGrid ECGPaperGrid | This example shows you demonstrates mm-grid equivalent of ECG paper. | 2DViewXYCartesianLineEcgEkgMillimetermmPaperDataCursorBioMVVM |
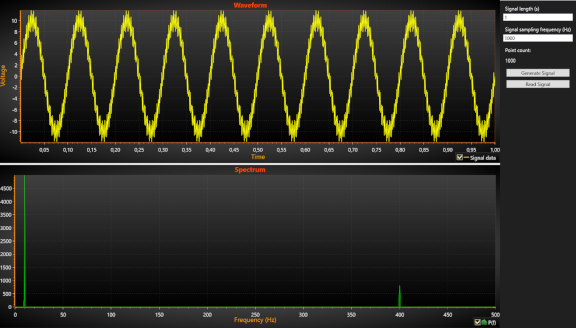 FFT FFT | Waveform and area spectrum plot. | 2DViewXYCartesianLineSignalSignaltoolsSignalreaderFftSpectrumArea |
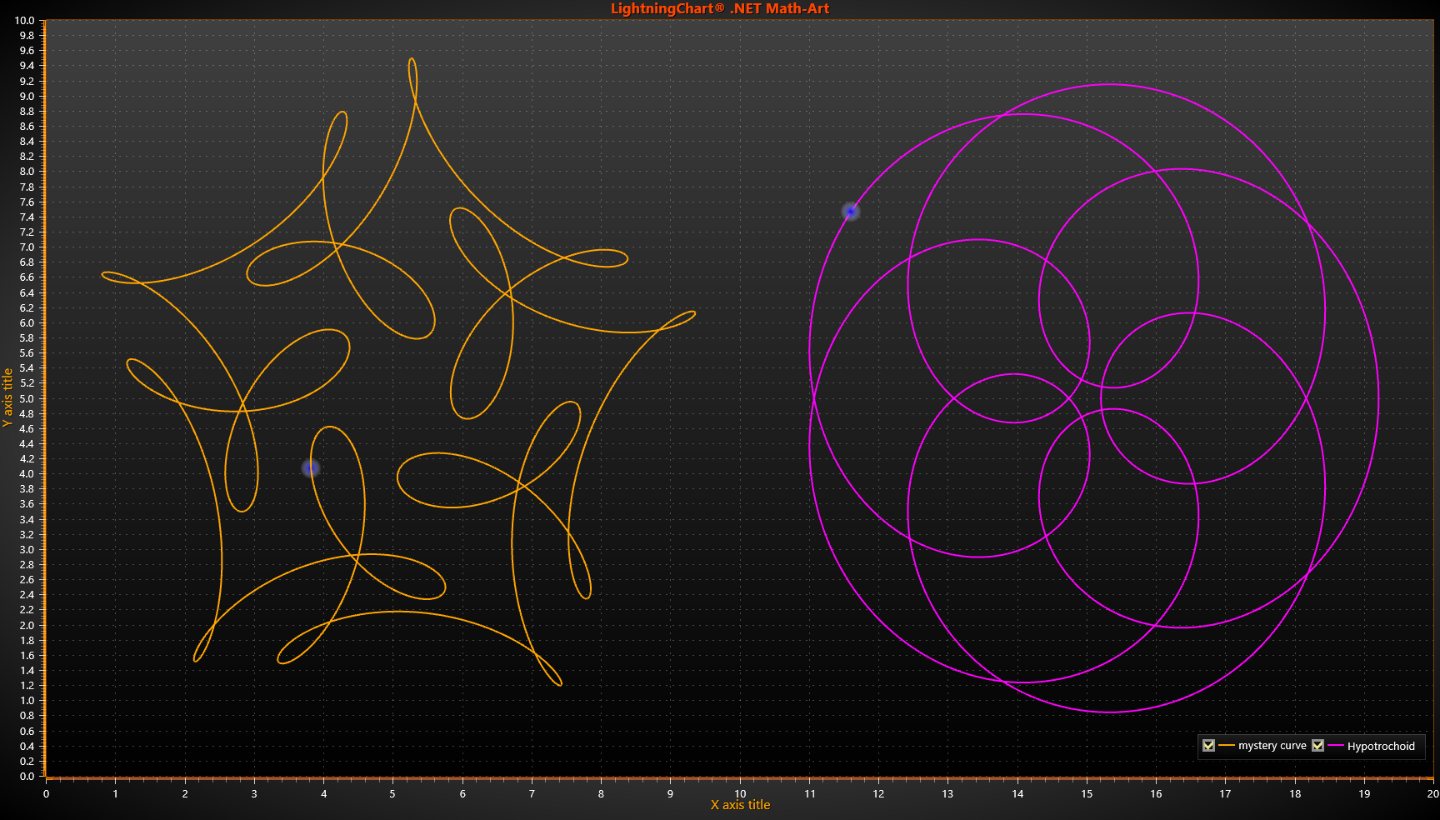 FreeformArt FreeformArt | Hypotrochoid and mystery curve Art created with LiteFreeformLineSeries. | 2DViewXYCartesianLiteFreeformLineRealtimeStreamingPointCountLimitMarkerHypotrochoidMystery |
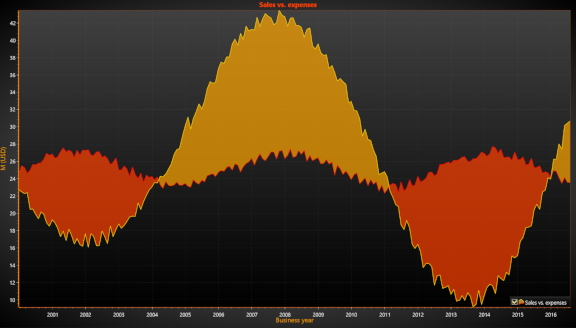 HighLow HighLow | In this example we want to show how easy is use High-lowSeries. How you can color High-low series with difrent colors. | BasicsViewXYHigh-lowLegendBoxDataCursorMVVM |
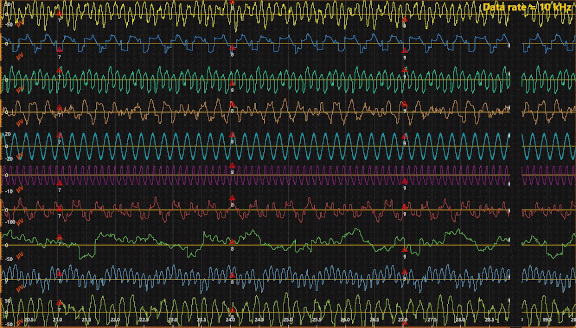 HiSpeedXY HiSpeedXY | Massive count of channels with high sample rate. Try various scrolling modes. Add markers. Stop signal generator to enter data review. Test your computer by setting higher sampling frequency and channel count. | 2DViewXYCartesianLineRealtimestreamingSampleSamplingSampleDataBlockSeriesWaveformEkgEcgEegSignalGeneratorStackSegmentsScrollingSweepingMarkersChannelPerformance |
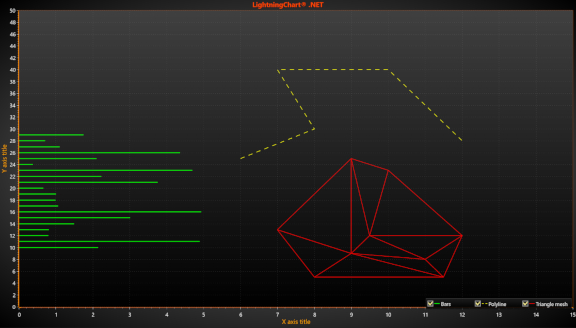 LineCollections LineCollections | LineCollection objects example. Very fast rendering of arbitrary line segments. | 2DViewXYCartesianLineCollectionLinecollectionMVVM |
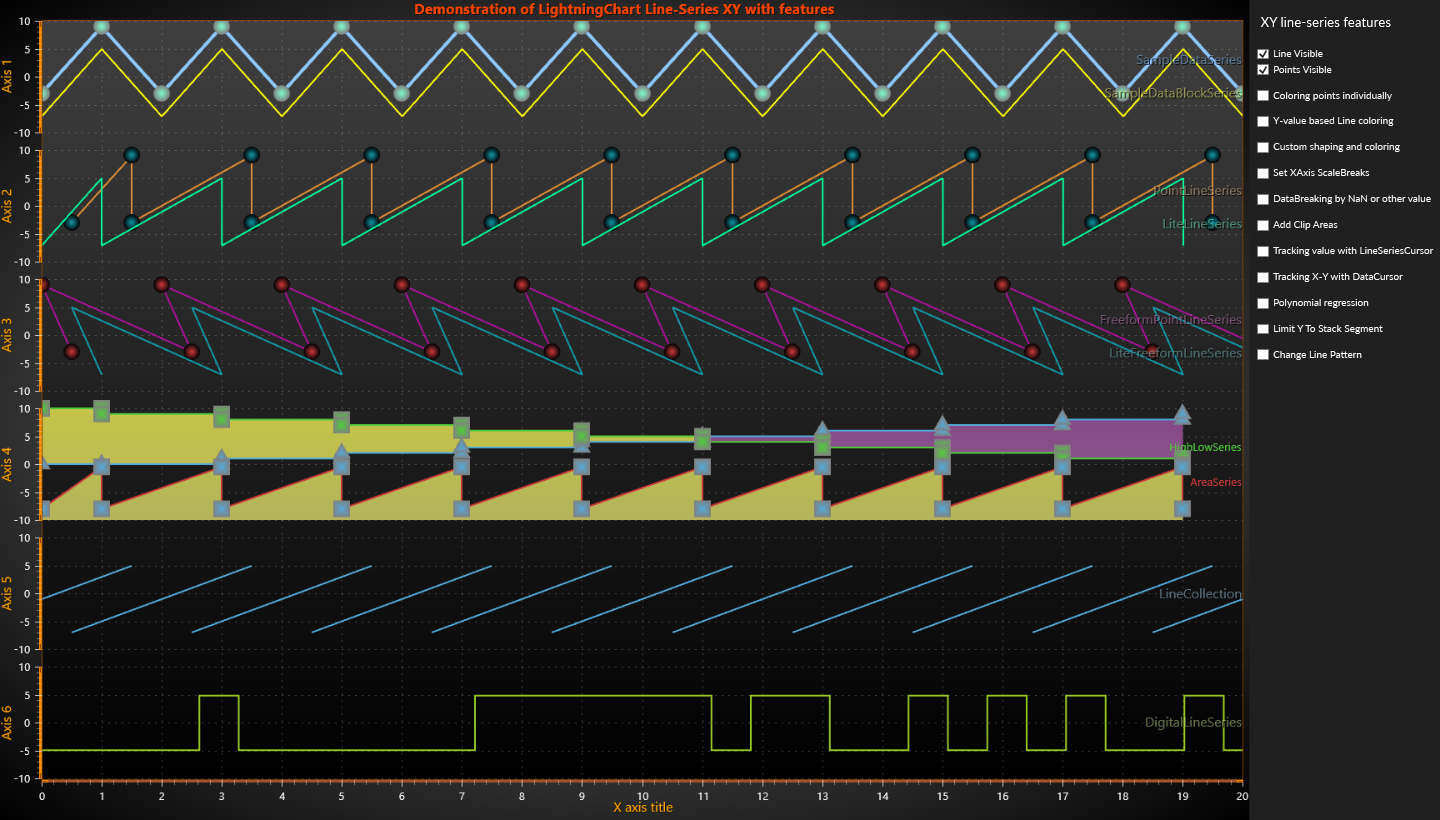 LineSeriesXYFeatures LineSeriesXYFeatures | XY Line-series Features Comparison example. In this example many LightningChart's features applicable to XY series is demonstrated. As many as 10 line-series could be used. Each of them optimized for different usage case. Therefore, series have different performance, assumptions and different set of features. | 2DAdvancedViewXYAxesDiversitySampleDataBlockSeriesSampleDataSeriesLiteLineSeriesPointLineSeriesLiteFreeformLineSeriesFreeformPointLineSeriesAreaseriesHighLowSeriesLineCollectionDigitalLineSeriesLineSeriesCursorHairCrossDataCursorCursorTrackIndividualPointColoringUsePaletteValueRangePaletteCustomLinePointColoringAndShapingScaleBreakDataBreakingClipAreaRegressionFittingLimitYToStackSegmentLineStyleCartesian |
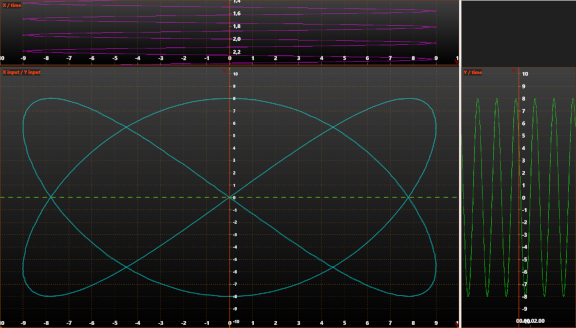 LissajousXY LissajousXY | This example shows you Lissajous figure monitor with FreeformPointLineSeries. | 2DViewXYCartesianLineRealtimestreamingFreeformLissajousInstrumentScrollingMVVM |
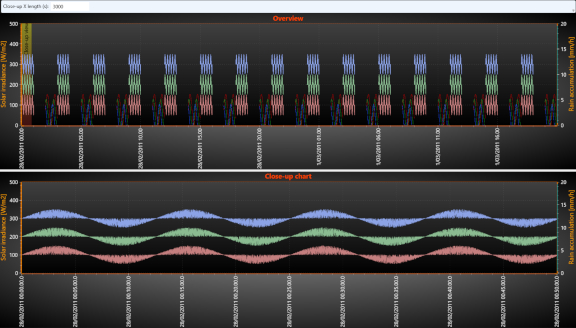 LongDataAnalysis LongDataAnalysis | This example shows you review of large data set of measurements. | 2DViewXYLineSampleDataSeriesLongAnalysisReviewBandValuesChangedZoomBandRangeCartesian |
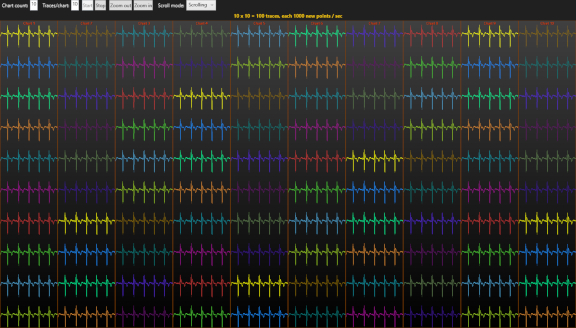 LotsOfRealtimeTraces LotsOfRealtimeTraces | This example shows you 1000 traces by setting 25 charts, 40 traces in each | DashboardPerformance2DViewXYRealtimeStreamingLineSampleDataSeriesMultiLotSampleScrollingSweepingStackedSignalReaderCartesian |
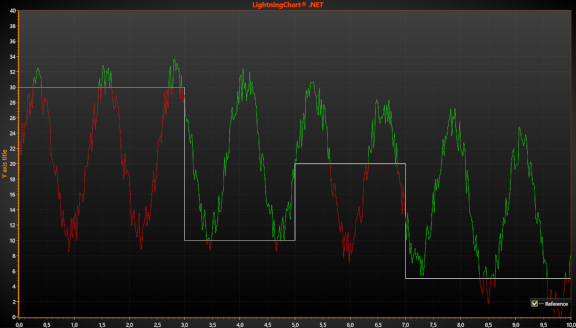 MultiColorLineEvent MultiColorLineEvent | This example shows you making advanced multi-coloring features and modifying line coordinates. | 2DViewXYCartesianPaletteColoringLinePointLineSeriesTriggerEventCustomLinePointColoringAndShapingMVVM |
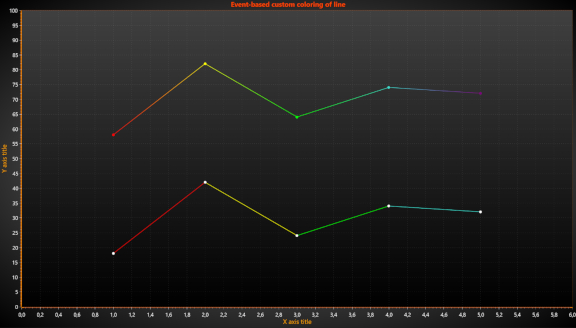 MultiColorLineIndicesXY MultiColorLineIndicesXY | This example shows you line series multi-coloring by event and by using indices information | 2DViewXYCartesianPaletteEventColoringLineFreeformPointLineSeriesIndicesCustomLinePointColoringAndShapingIndividualPointColoringPointColoringTargetMVVM |
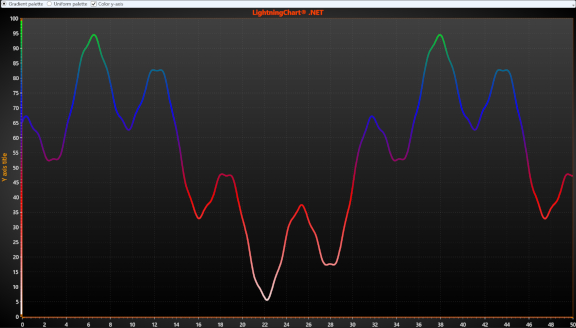 MultiColorLinePalette MultiColorLinePalette | This example shows you line series multi-coloring by value range palette. Line can be colored, and optionally the Y axis too. | 2DViewXYPaletteValueRangePaletteUsePalettePointLineSeriesColoringLineCartesianDataCursorMVVM |
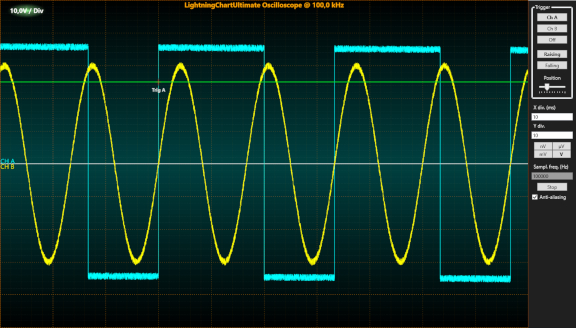 OscilloscopeXY OscilloscopeXY | In this example implemented with triggering X axis and SampleDataSeries. | Advanced2DViewXYOscilloscopeTriggeringLineRealtimeStreamingSampleDataSeriesMarkerConstantLineAnnotationSignalGeneratorLevelCartesianMVVM |
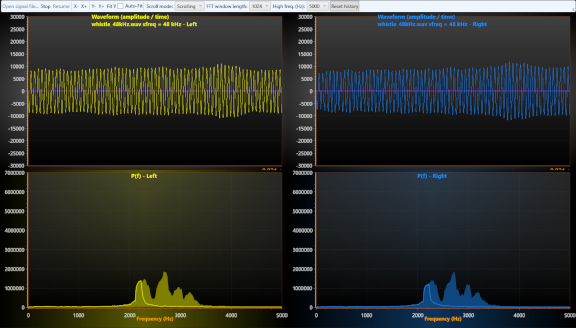 PersistentFFT PersistentFFT | SignalReader component is used to read data from a file, to generate a playback. Waveform is displayed on the top. FFT is calculated in real-time and plotted in line series below. Moving average filter is used to smoothen the FFT data. Persistent history data (envelope) is shown in the background with HighLowSeries. | AdvancedShowcase2DViewXYRealtimeStreamingSignalReaderFFTSpectrumAreaSignaltoolsLineScrollingWaveformSpectrogramEnvelopePersistentSignalProcessingMovingAverageHighLowSeriesConstantLineSampleDataSeriesSpectrumCalculatorPowerSpectrumCartesian |
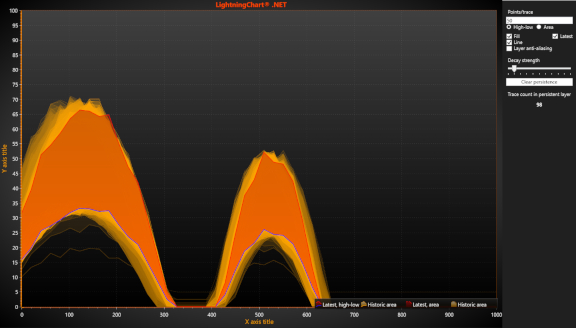 PersistentRenderingHighLowAreas PersistentRenderingHighLowAreas | Persistent series rendering layer example. Historic area/high-low traces are rendered into persistent image layer. Each update round, the existing image is decayed by selected value. | 2DViewXYPersistentLayerPersistenceRenderSeriesHighLowSeriesAreaSeriesPersistentSeriesRenderingLayerCartesianMVVM |
 PointLineSeriesXY PointLineSeriesXY | Simple point line series demonstration. | Basic2DViewXYPointLineSeriesLineLineSeriesCursorCursorSnapToPointsCartesianMVVM |
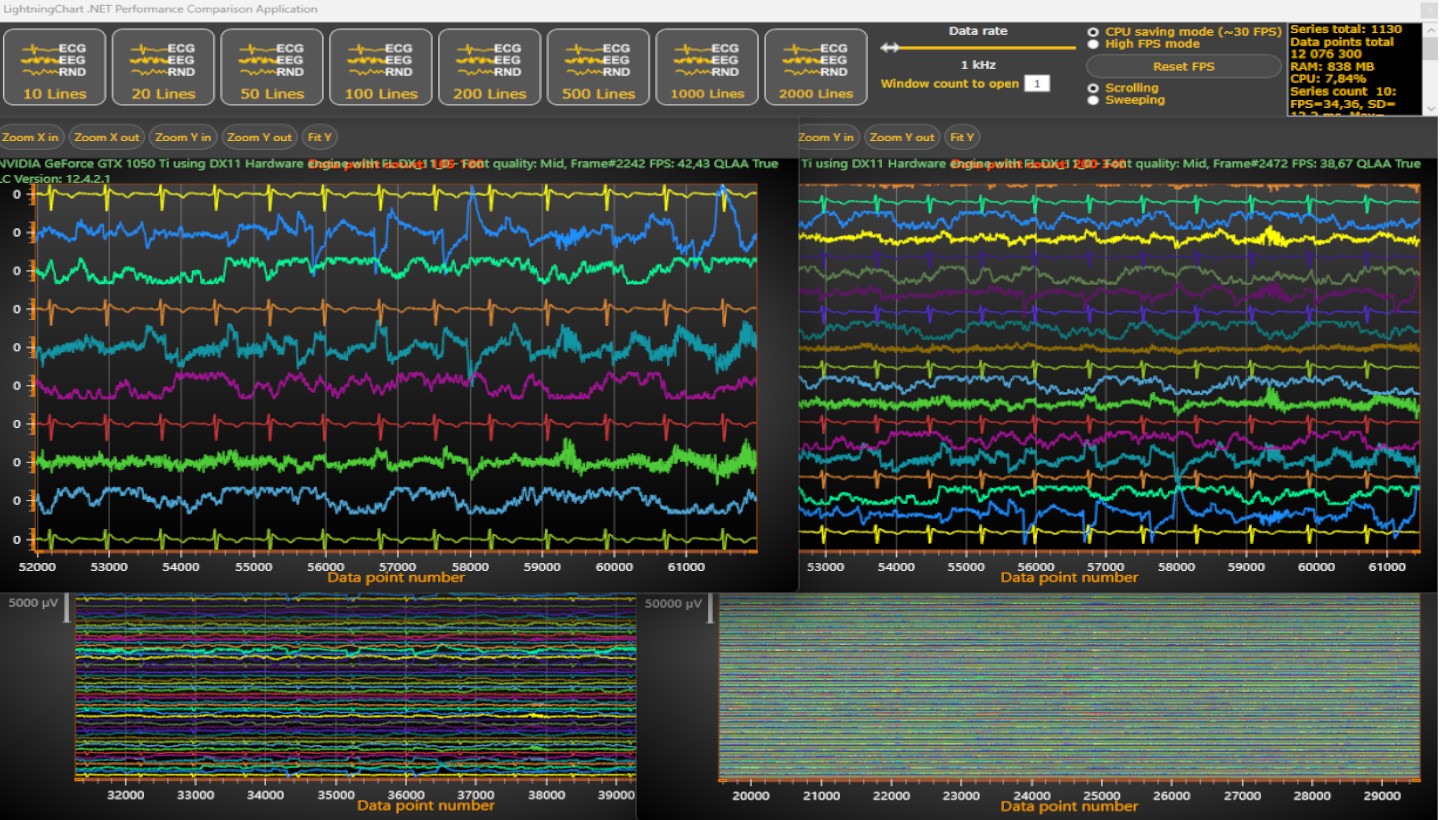 SampleDataBlockSeriesDemo SampleDataBlockSeriesDemo | High-Performance Test Application (standalone). The application consists of a header bar, and the test application allows opening dozens of chart windows. The data rate is adjustable, starting from 1000 Hz (1000 data points/sec) for each series. Each window can be opened with a preferred series count between 10-2000. | ViewXYLineRealtimeStreamingAdvancedTestBenchSegmentsScrollingSweepingShowcasePerformanceSampleDataBlockSeriesMultiYAxisMulti-WindowStandaloneNewAdded |
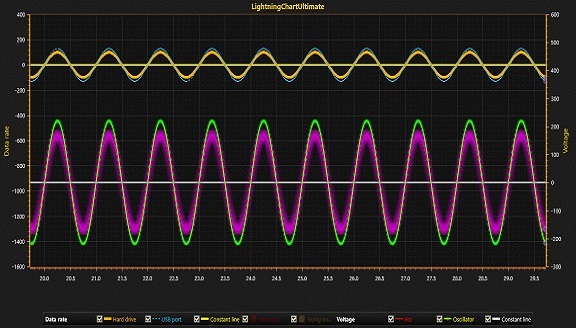 ScrollingXY ScrollingXY | PointLineSeries, various line styles, with bitmap and gradient based point styles. Stop signal generator to enter data review. Drag axes and their end points to edit range. | Advanced2DViewXYRealtimeStreamingScrollingSignalSignalGeneratorMarkerLayeredLinePointsPointLineSeriesConstantLineBandLineSeriesCursorPatternStyleBitmapScrollBarHorizontalScrollBarCartesianMVVM |
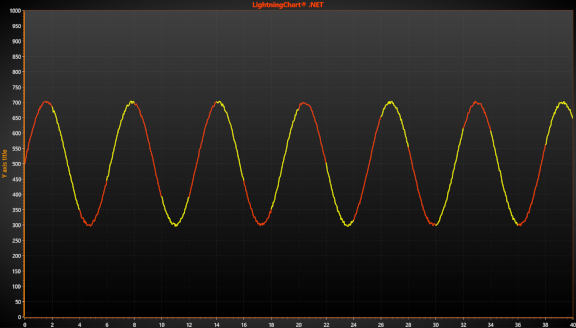 SegmentedLineXY SegmentedLineXY | Segmented line presented with several point line series. | BasicViewXYSegmentedLinePointLineSeriesMVVM |
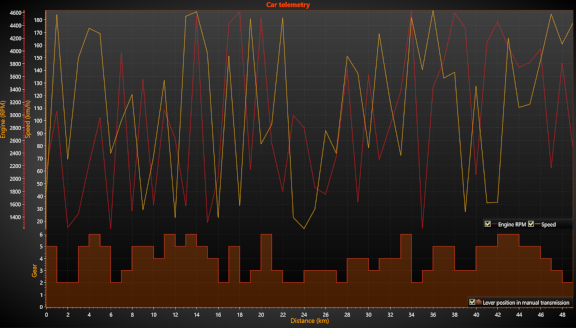 SegmentsWithLegends SegmentsWithLegends | In this Example of Multi legends Chart is divided to several segments, each contains its own legend. | Basic2DViewXYSegmentedLegendLegendBoxesPointLineSeriesAreaSeriesTelemetryMVVMCartesian |
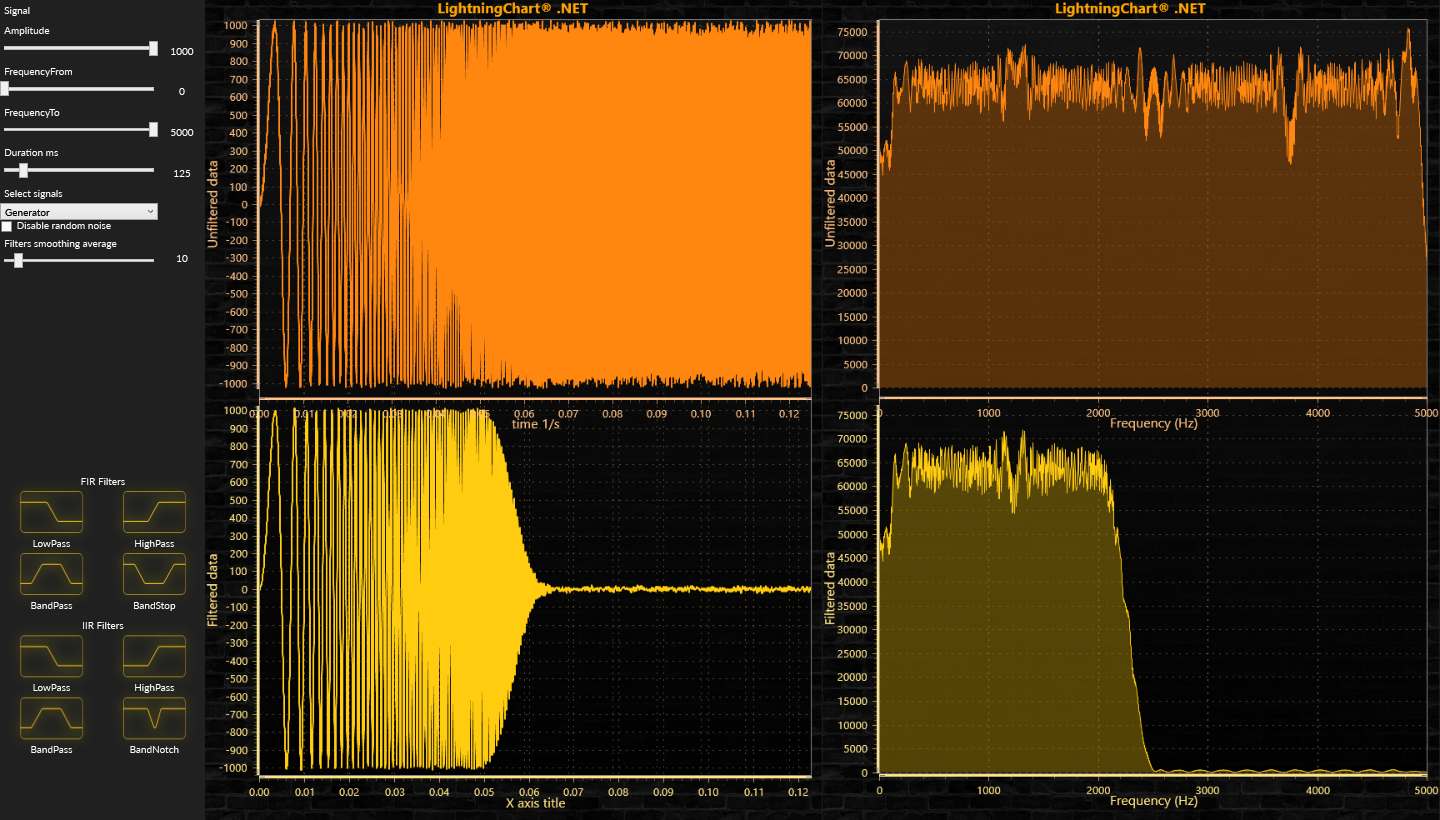 SignalFilters SignalFilters | Digital signal filters example. Digital signal filters are programmatic filters made to filter out unwanted frequencies from the acquired signal data. Finite Impulse Response (FIR) filters are amplitude-stable, constant-phase-shift filters, and cause a constant lag in the data. The higher the factor count (taps), the longer the delay. Infinite Impulse Response (IIR) filters are minimal-lag filters, but introduce phase shift depending on the input frequency, and are unstable if designed poorly. This example feeds different signals from SignalGenerator control, waveforms, which contain different frequencies. The waveform data is filtered with SignalTools' FIRFilter and IIRFilter, and shown as filtered waveform and its spectrum. Signal Filters IIR filter's creation has been used http://jaggedplanet.com/iir/iir-explorer.asp Signal Filters FIR filter's creation has been used http://t-filter.engineerjs.com/ | AdvancedShowcase2DViewXYSignalFiltersIIRFIRRealtimeStreamingSignalGeneratorSpectrumCalculatorSampleDataBlockSeriesAreaSeriesWaveformsSpectrum |
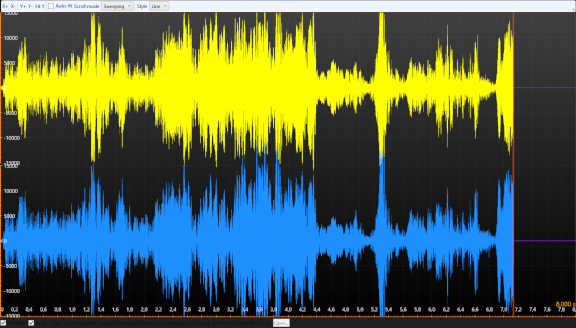 SignalReader SignalReader | This example shows you to read data from file and to generate a playback. Data is directed to SampleDataSeries of ViewXY. | Advanced2DViewXYRealtimeStreamingSignalSignalReaderSampleSampleDataSeriesSignalProcessingWaveformStackScrollingSweepingLineSeriesCursorsConstantLineCartesianMVVM |
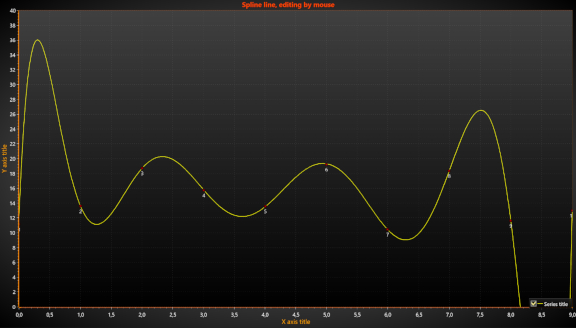 SplineLineMouseEdit SplineLineMouseEdit | This example shows you spline line editing by mouse. | Basic2DViewXYMarkerFittingPolynomialRegressionSplineMouseEditFreeformPointLineSeriesLineMVVM |
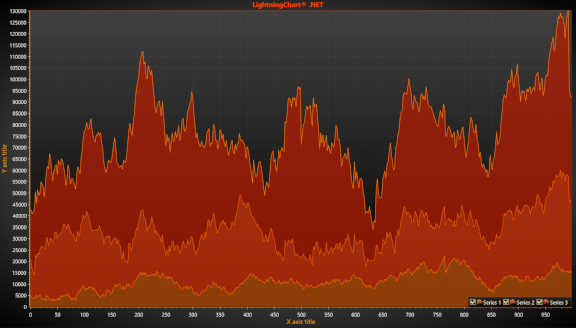 StackedArea StackedArea | Stacked areas example, implemented with High-Low series. | 2DBasicViewXYHighLowSeriesAreaMountainFillStackedMVVM |
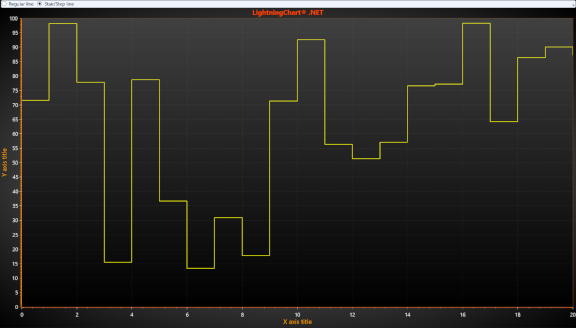 StairStepLine StairStepLine | This example shows you stair/step line presentation with PointLineSeries. | Basic2DViewXYStairStepPointLineSeriesDataCursorLineCartesianMVVM |
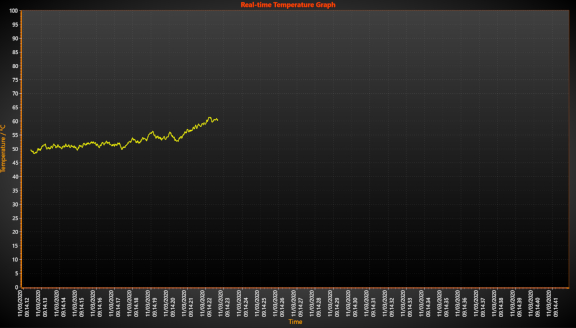 TemperatureGraph TemperatureGraph | This example shows you real-time temperature monitor graph with date/time axis. | 2DViewXYLiteLineSeriesRealtimeStreamingScrollingAppendDataCursorCartesianLineMVVM |
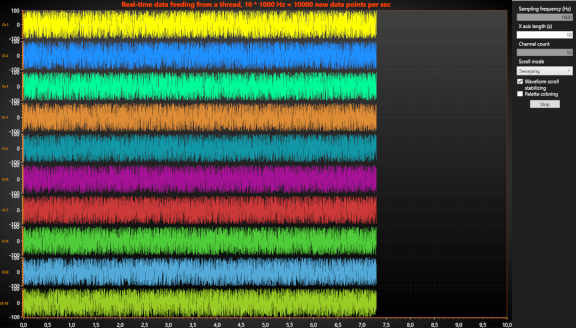 ThreadMultiChannel ThreadMultiChannel | In this example Data is generated using a (non-UI) thread and displayed using SampleDataSeries. | PerformanceAdvanced2DViewXYRealtimeStreamingSamplingThreadWaveformSampleDataSeriesEkgEcgEegInvokeStackedSegmentScrollingSweepingScrollingStabilizingUsePaletteValueRangePaletteChannelCartesianLineMVVM |
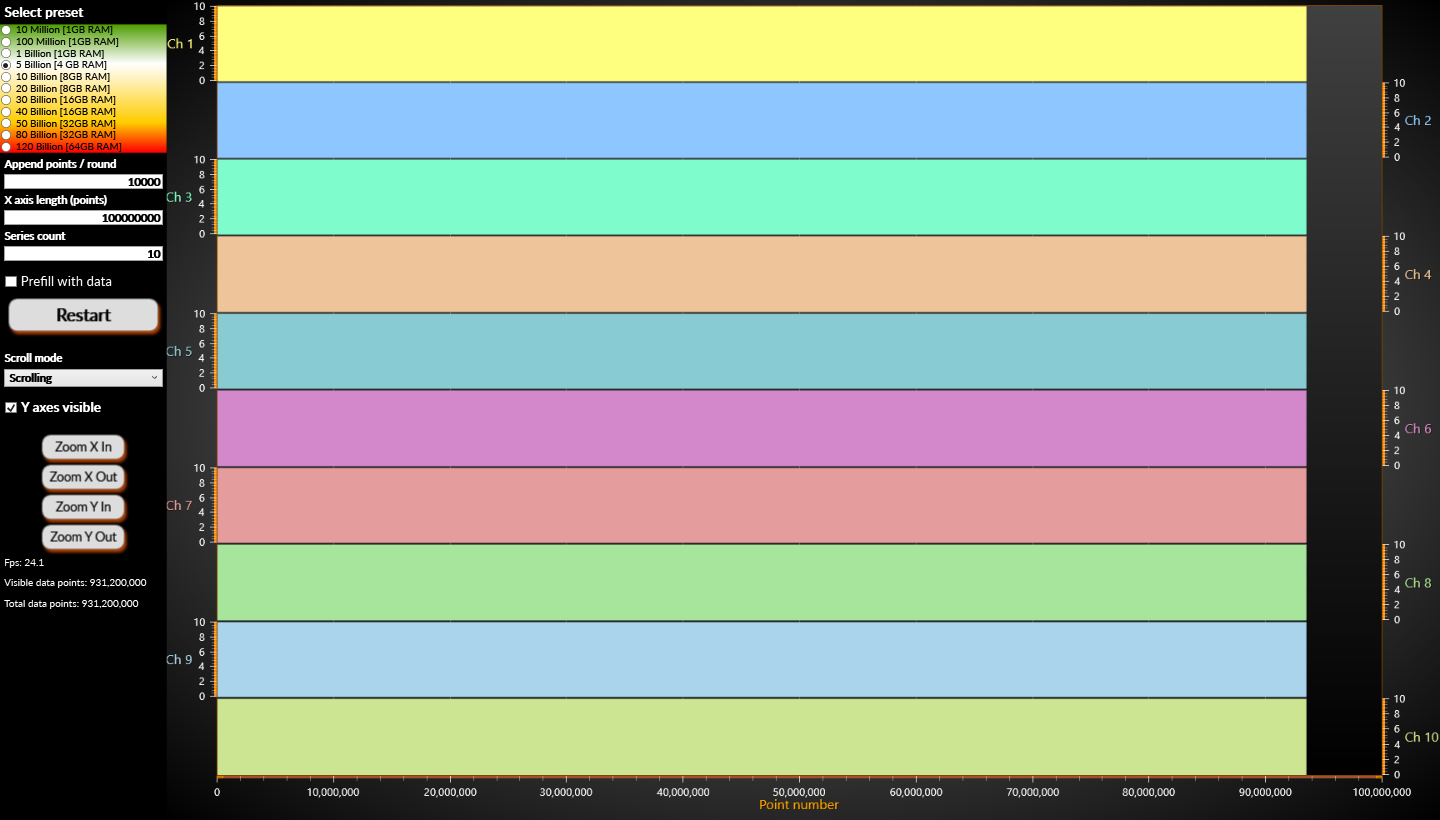 TrillionDigital TrillionDigital | Scrolling Digital line of 1 TRILLION (1,000,000,000,000) data points. | ShowcasePerformance2DTrillionViewXYDigitalLineSeriesRealtimeStreamingStackSegmentsScrollingSweepingMiniScaleLineBillion |
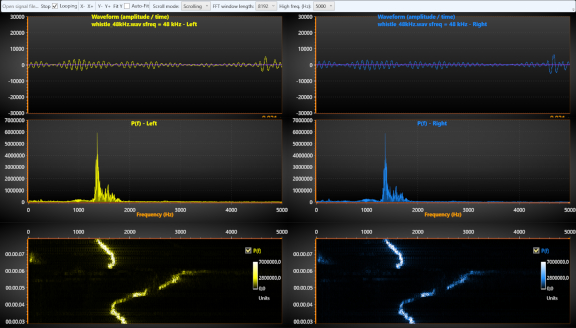 WaveFFT WaveFFT | SignalReader component is used to read data from a file, to generate a playback. Waveform is displayed on the top. FFT is calculated in real-time and the spectrum data is displayed in area plot and spectrogram. | ShowcaseAdvanced2DViewXYCartesianSignalReaderFFTSpectrumRealtimeStreamingAreaSeriesSampleDataSeriesIntensityGridSeriesHeatmapScrollingWaveformSpectrogramPalette |
Spectrograms & Waterfall Charts13 examples
| Example | Description of example | Tags |
|---|---|---|
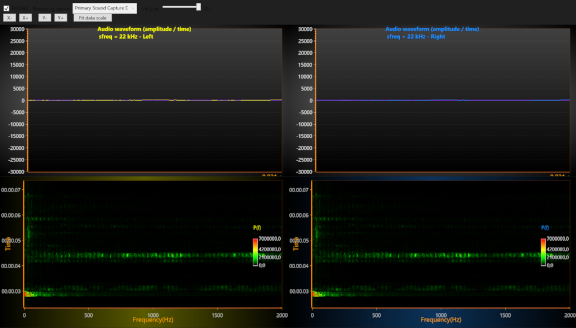 AudioInputSpectrogram AudioInputSpectrogram | AudioInput component is used to input waveform data from a sound device, such as mic-in or line-in. The real-time waveform data is plotted in waveform graphs. | 2DViewXYCartesianAudioInputFftSpectrumSignaltoolsLineIntensityGridHeatmapScrollingWaveformSpectrogramPaletteColoringMic-in |
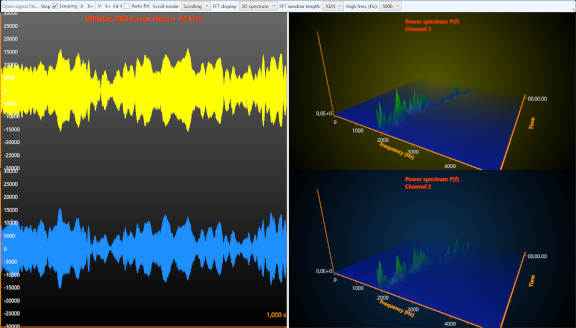 AudioSpectrogram3D AudioSpectrogram3D | SignalReader component is used to read data from a file, to generate a playback. Waveform is displayed on a chart on the left. FFT is calculated in real-time and the spectrum data is displayed with selected spectrum analyzer on the right, each channel in it's own control. | 2DView3DViewXYXYZCartesianSignalreaderFftSpectrumSignaltoolsLineSurfacePaletteColoringHeatmapScrollingWaveformSpectrogram |
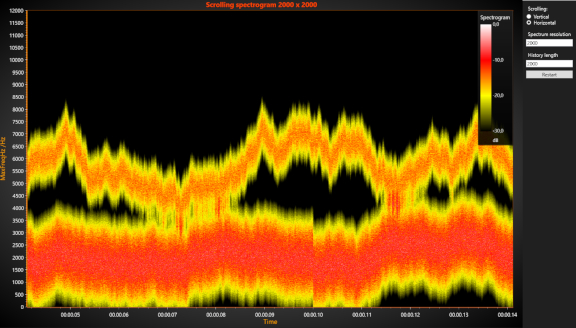 HighResolutionSpectrogramXY HighResolutionSpectrogramXY | This example shows you optimal way to plot spectrogram as fast as possible. | 2DViewXYCartesianRealtimestreamingSpectrumIntensityHeatmapSpectrogramScrollingWaterfall |
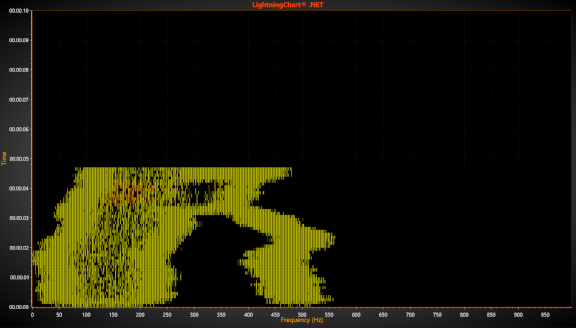 LineSpectrogram LineSpectrogram | Line spectrogram example. | 2DViewXYCartesianLineLinecollectionSpectrumSpectrogramScrolling |
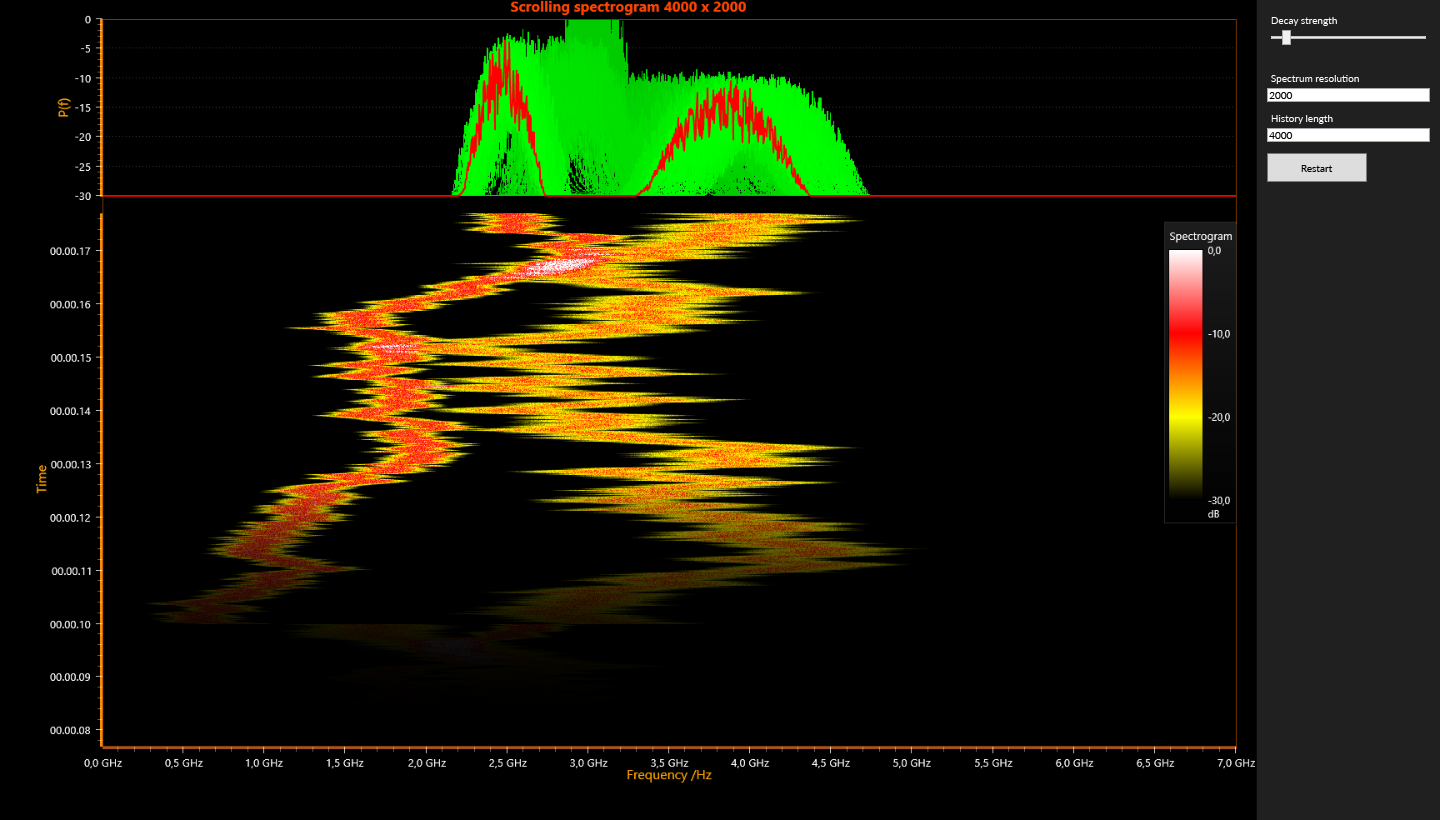 MonitoringBroadbandRFspectra MonitoringBroadbandRFspectra | Example shows the real-time spectrogram as line and heatmap charts with fading effect. | ViewXYSpectrogramIntensityGridSeriesPersistentSeriesRenderingLayerPointLineSeriesBandsFFTIndividualPointColoringSegmentsYAxisSegmentSetColorsDataFormatValueLabelMultiplyAlphaRenderSeriesPalette2DNewAdded |
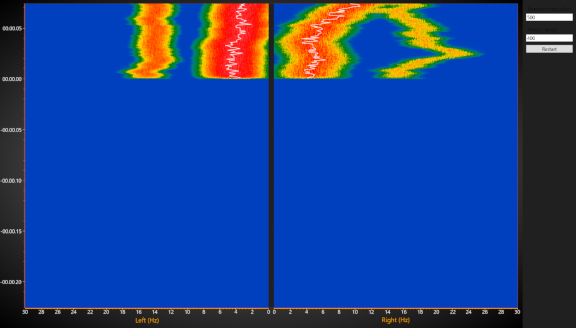 SideSpectrogram SideSpectrogram | In this example of Left & Right spectrogram. Two IntensityGridSeries put in stacked layout, and the whole chart rotated 90 degrees. | Performance2DViewXYRealtimeStreamingSpectrumIntensityGridSeriesHeatmapSpectrogramScrollingSetValuesDataMVVMCartesian |
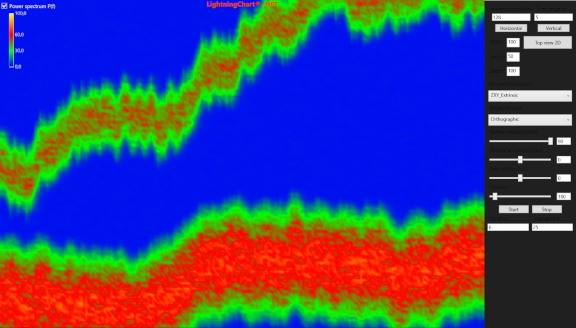 Spectrogram Spectrogram | Spectrogram shows signal spectrum vs. time. It is constructed from Orthographic top view of 3D surface grid series. | AdvancedPerformanceView3DSurfaceRealtimeStreamingSurfaceGridSeries3DScrollingSpectrumSpectrogramOrthographicInsertColumnBackAndScrollXYZMVVM |
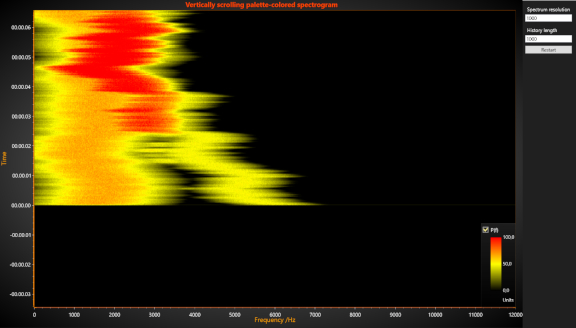 Spectrogram2D Spectrogram2D | This example shows you Scrolling spectrogram example, made with IntensityGridSeries, using Palette fill. | Performance2DViewXYRealtimeStreamingSpectrumIntensityGridSeriesHeatmapSpectrogramScrollingSetValuesDataCartesianMVVM |
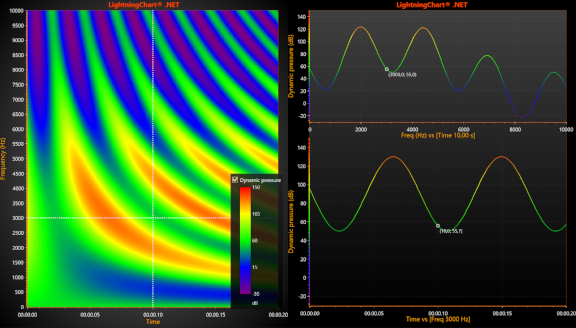 SpectrogramLayoutCursors SpectrogramLayoutCursors | Spectrogram cross-section example. The data ranges and cursors between charts are synchronized with events. | Advanced2DViewXYHeatmapIntensitySegmentedCursorConstantLineIntensityGridSeriesLineSeriesCursorColoringMarkerUsePaletteSyncCartesianMVVM |
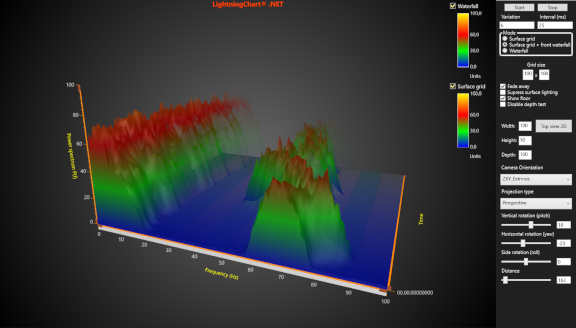 Spectrum3D Spectrum3D | 3D spectrum view with WaterfallSeries and SurfaceGrid series. | AdvancedView3DSurfaceWaterfallSpectrumRealtimeScrollingStreamingSurfaceGridSeries3DWaterfallSeries3DSpectrogramFadeAwayGridXYZMVVM |
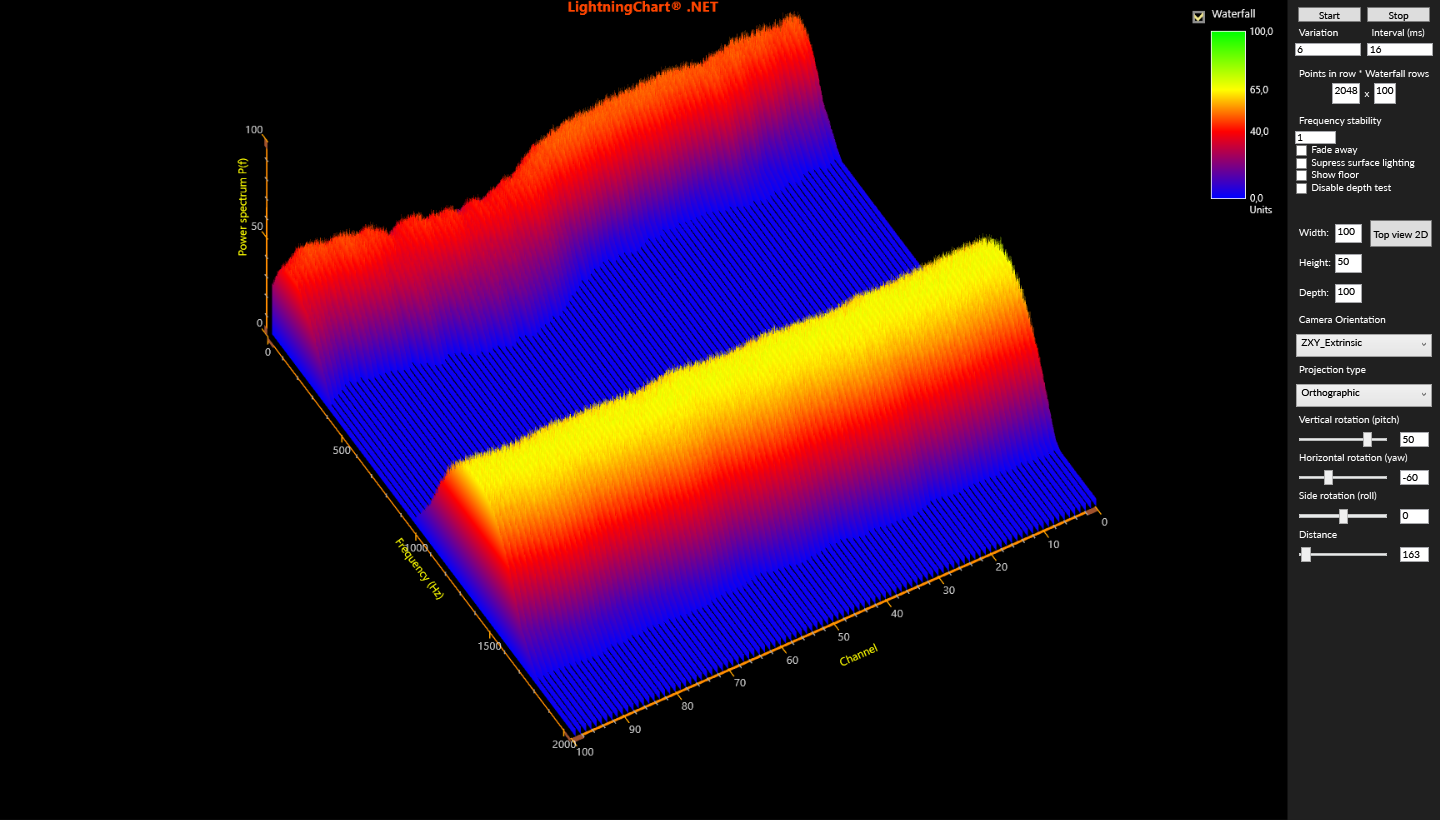 Spectrum3DWaterfall Spectrum3DWaterfall | 3D spectrum view with WaterfallSeries. | AdvancedView3DWaterfallSpectrumRealtimeStreamingSpectrogramWaterfallSeries3DAnimationPalettedFadeAwayXYZ |
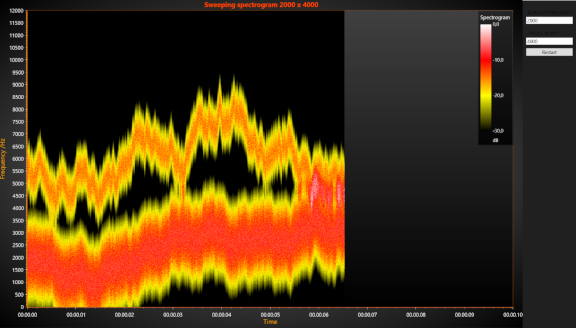 Sweeping2DSpectrogram Sweeping2DSpectrogram | Sweeping 2D spectrogram example, made with IntensityGridSeries using FromSurfacePoints fill. | AdvancedPerformance2DViewXYRealtimeStreamingSpectrumIntensityGridSeriesHeatmapSpectrogramSweepingFromSurfacePointsSetColorsDataFromSurfacePointsCartesianMVVM |
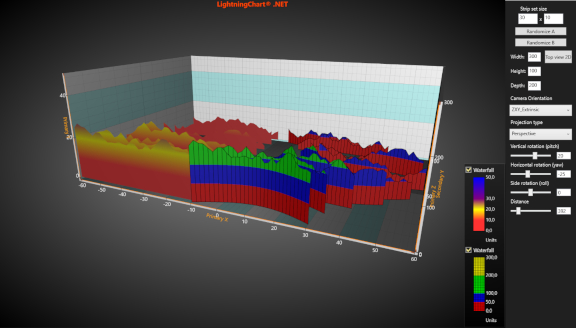 WaterFall3D WaterFall3D | WaterfallSeries3D demonstration. Waterfalls are often used vibration analysis applications. | AdvancedView3DXYZWaterfallBendingWarpingPaletteColoringMVVM |
Maps & Geospatial Charts14 examples
| Example | Description of example | Tags |
|---|---|---|
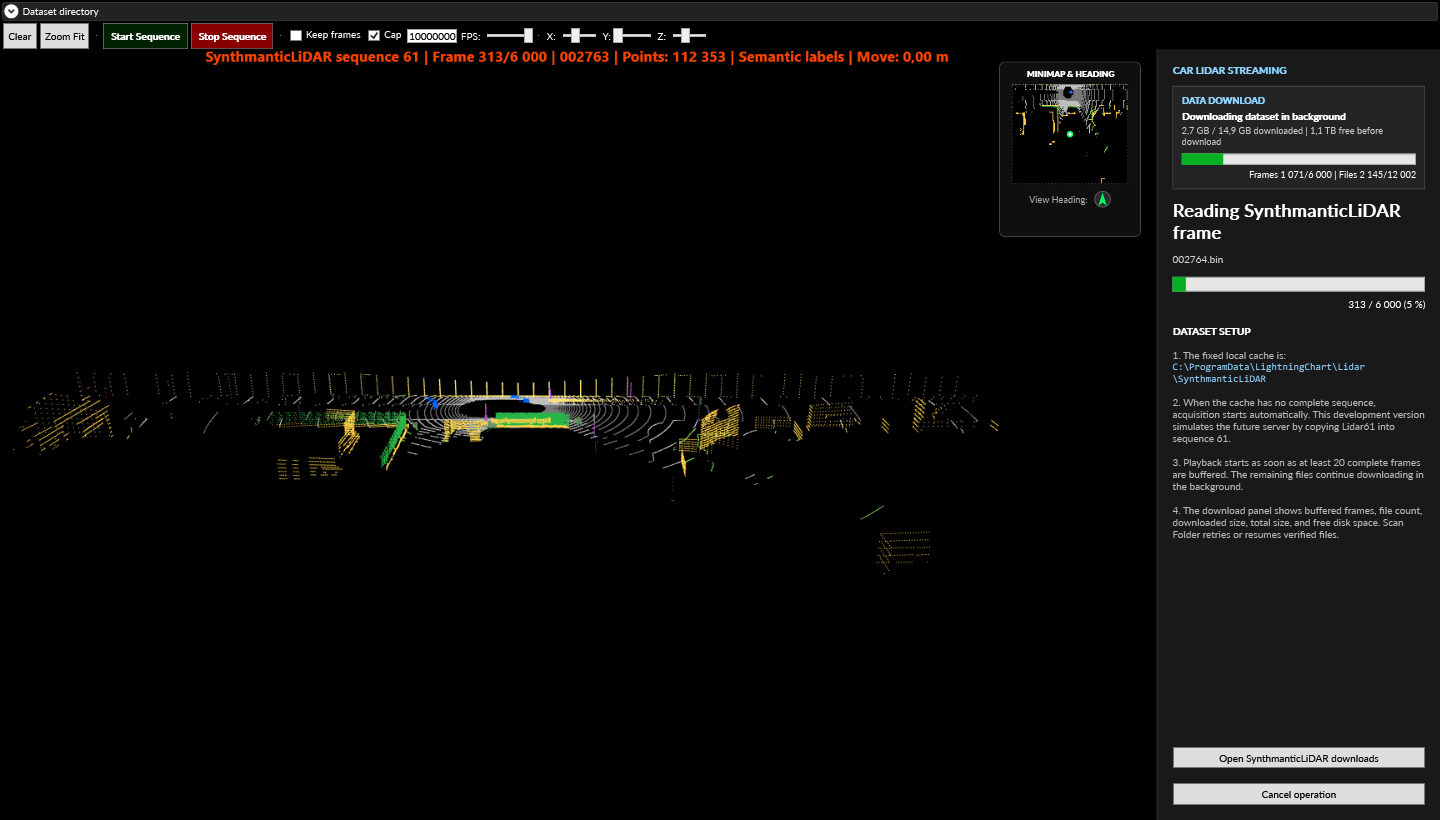 CarLidar CarLidar | Recorded SynthmanticLiDAR frames are cached in C:\ProgramData\LightningChart\Lidar\SynthmanticLiDAR. If no complete sequence is cached, the configured Cloudflare Worker downloads sequence 61 automatically. Playback begins once 100 complete Velodyne frames are buffered; the rest keep downloading in the background. The panel reports buffered frames, transfer progress, and free disk space. Interrupted acquisition resumes from verified files, and "Scan Folder" retries. Playback speed is set in frames per second. "Show scan history" retains completed scans, placed by LiDAR odometry: the ten newest form a fading red trail and earlier ones keep their semantic or height-based colors. The minimap draws the current frame from above with the vehicle marker centered on a fixed square X/Z scale. Odometry runs for every frame, so the direction arrow shows the car's travel direction as seen from the 3D camera whether or not the history is retained. The Dimensions sliders rescale View3D.Dimensions in real time: X sets Width, Y sets Height, Z sets Depth. Point coordinates are unchanged. "Zoom Fit" fits all displayed points in the X, Y, and Z axis ranges and moves the camera to show the whole cloud. | ShowcaseView3DLidarPointCloudPointLineSeries3DCompactPointsColorPointsOptimizationIndividualPointColorsSemanticSegmentationAnnotation3DMinimapCarSequenceStreamingDownload3DXYZTaskNewAdded |
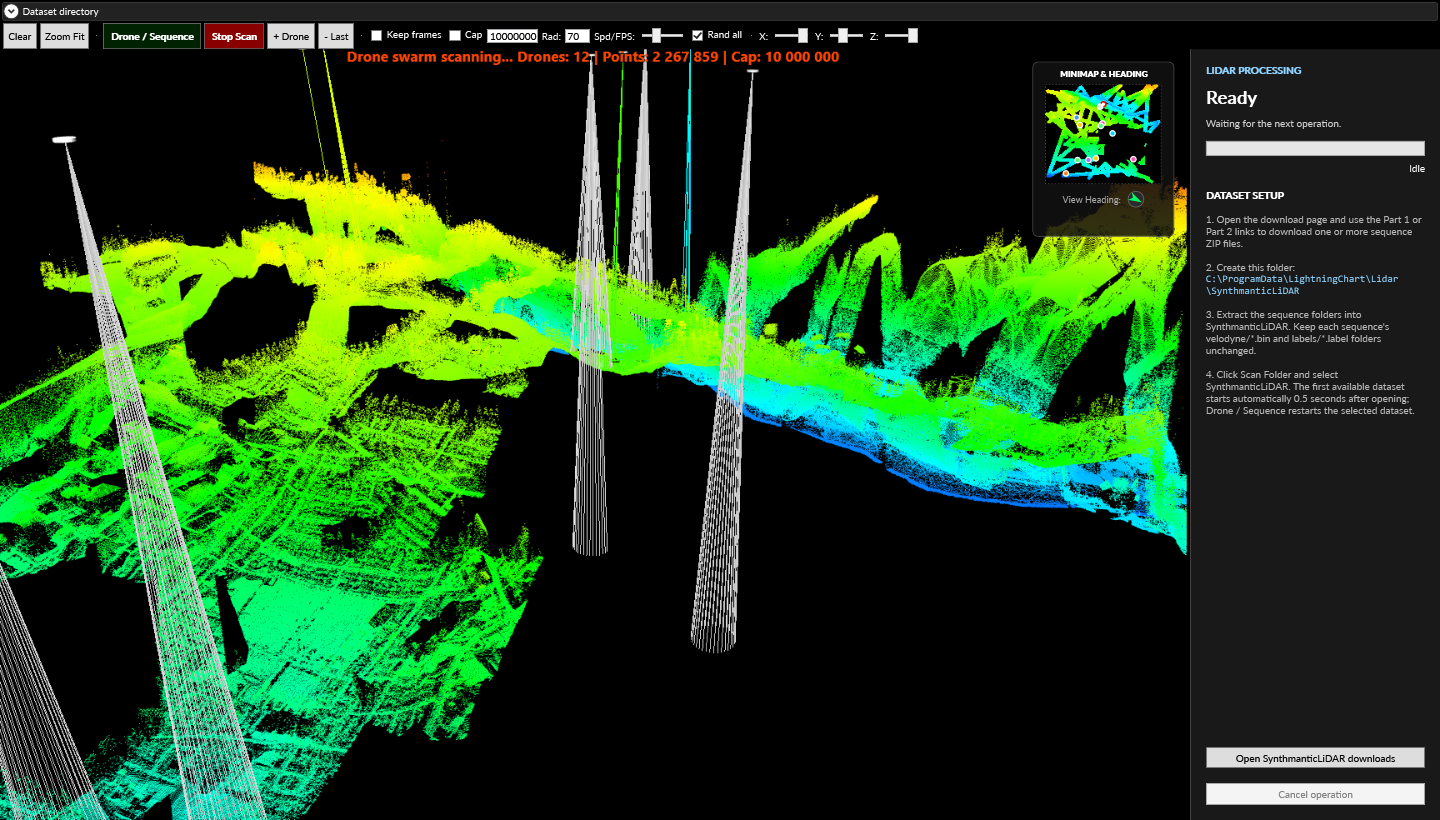 DroneLidar DroneLidar | Place LAS, LAZ, or ESRI ASCII grid files below C:\ProgramData\LightningChart\Lidar. "Scan Folder" refreshes the list; "Start Drone Scan" restarts the selection. Five drones start by default, each on a random route with a scan radius of 50. Drones can be added or removed while scanning, and "Random scan direction" switches to parallel raster paths. Terrain is scanned into PointLineSeries3D objects of at most 1,000,000 points each. The minimap shows discovered terrain and drone positions in each drone's color, with an arrow for the 3D camera's viewing direction. The Dimensions sliders rescale View3D.Dimensions in real time: X sets Width, Y sets Height, Z sets Depth. Terrain coordinates are unchanged. "Zoom Fit" fits the scan, drones, and rays in the X, Y, and Z axis ranges and moves the camera to show the whole scene. | ShowcaseView3DLidarPointCloudPointLineSeries3DCompactPointsColorPointsOptimizationIndividualPointColorsMultiColorLineLASASCMinimapDroneStreaming3DXYZTaskNewAdded |
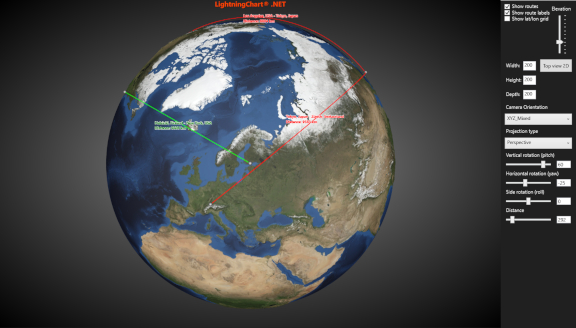 GlobeSurface3D GlobeSurface3D | Globe demo, earth surface is made with SurfaceMeshSeries3D, from manipulated SRTM-90 (CGIAR-CSI) elevation data and a photo (NASA). Flight routes are calculated with ChartTools methods from city coordinates using shortest Great Circle route. PointLineSeries3D and Annotation objects are used to present them. | AdvancedView3DXYZSurfaceMeshElevationBitmapWorldPhotoFlightRouteLinePointsMVVM |
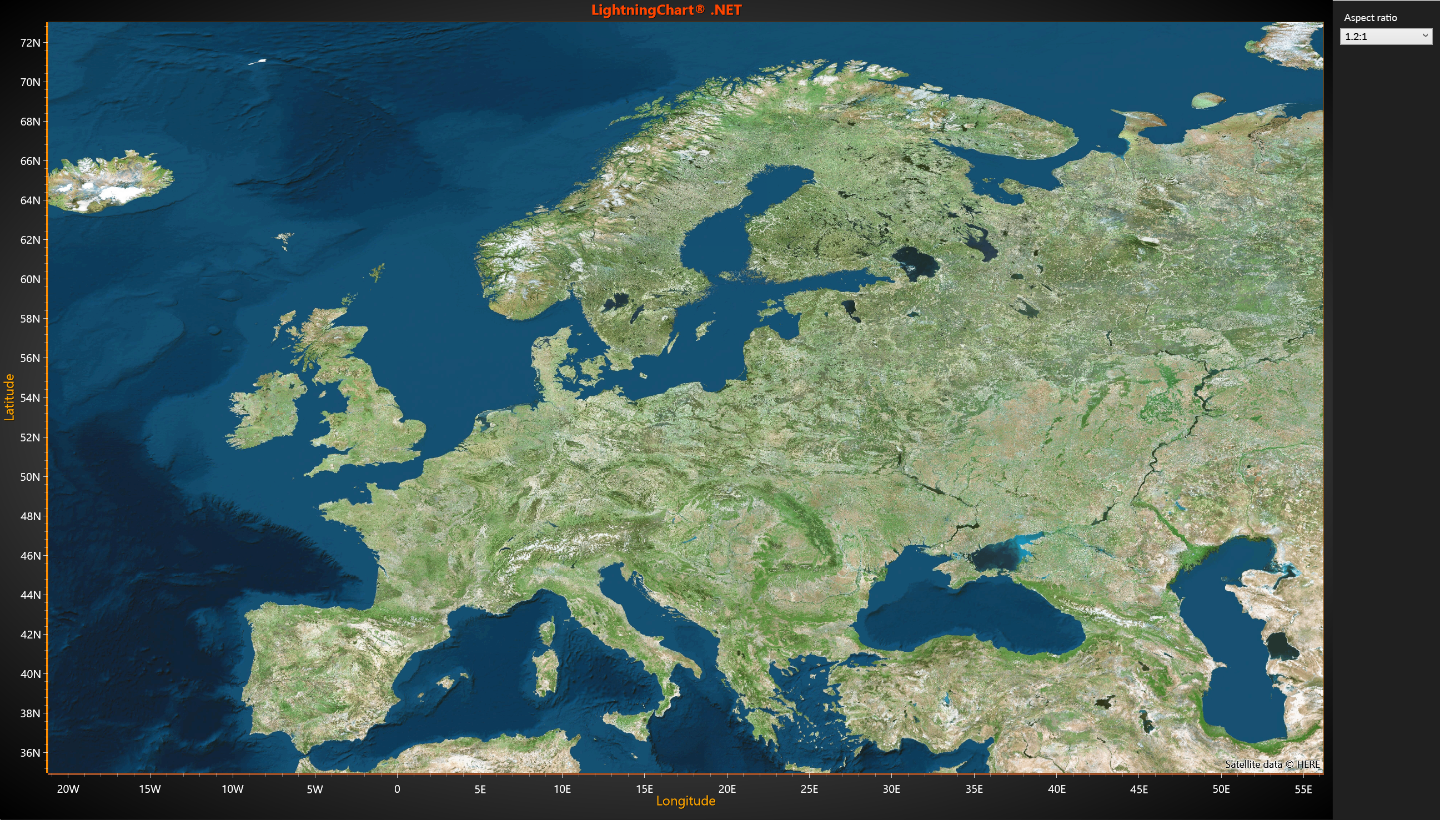 HEREMapsSatellite HEREMapsSatellite | MapQuest/OpenStreetMaps on-line TileLayer example, satellite imagery. https://www.here.com/get-started/pricing | 2DViewXYHEREmapTileLayer |
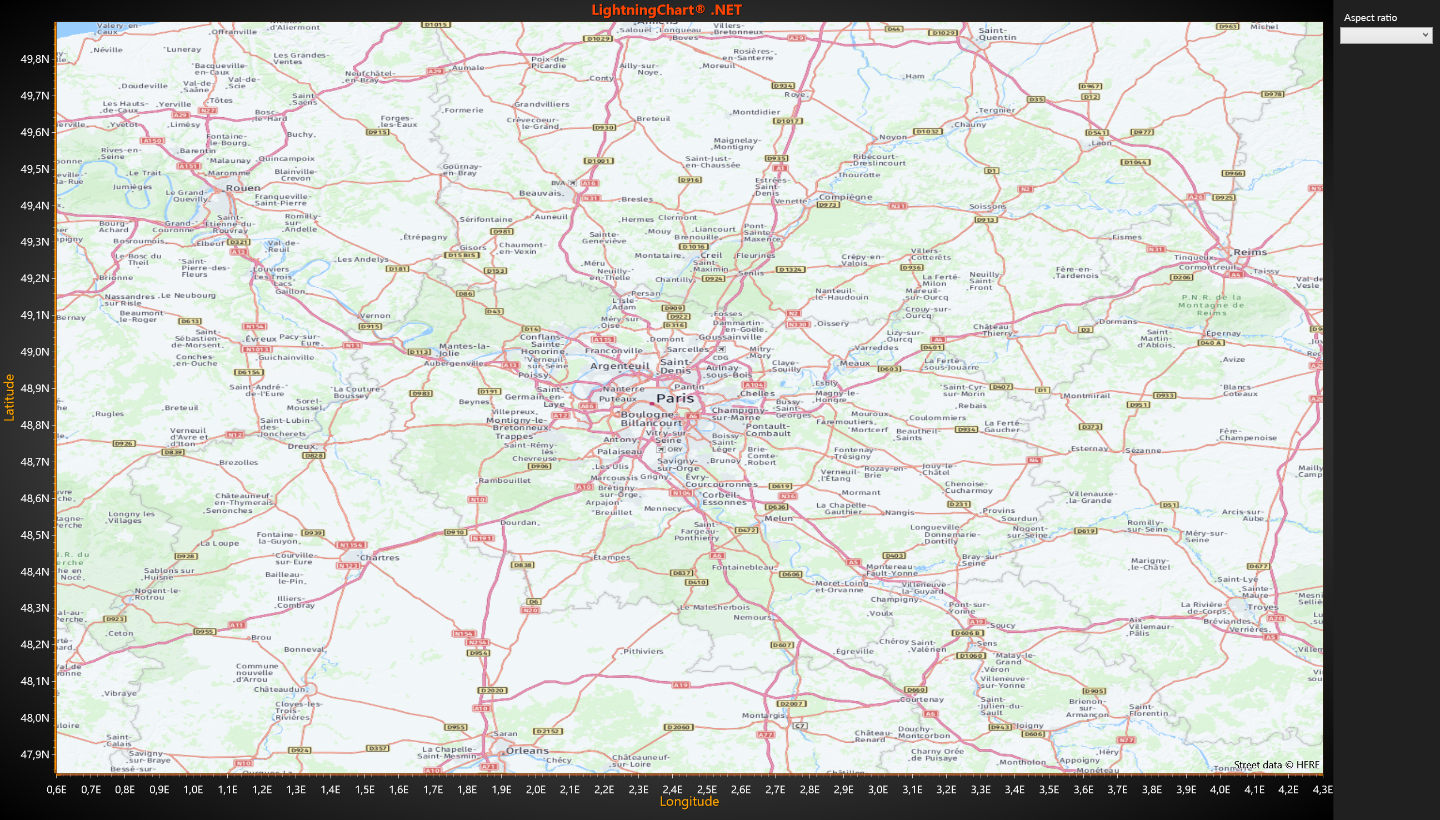 HEREMapsStreet HEREMapsStreet | on-line TileLayer example, street maps. https://www.here.com/get-started/pricing | 2DViewXYHEREmapTileLayer |
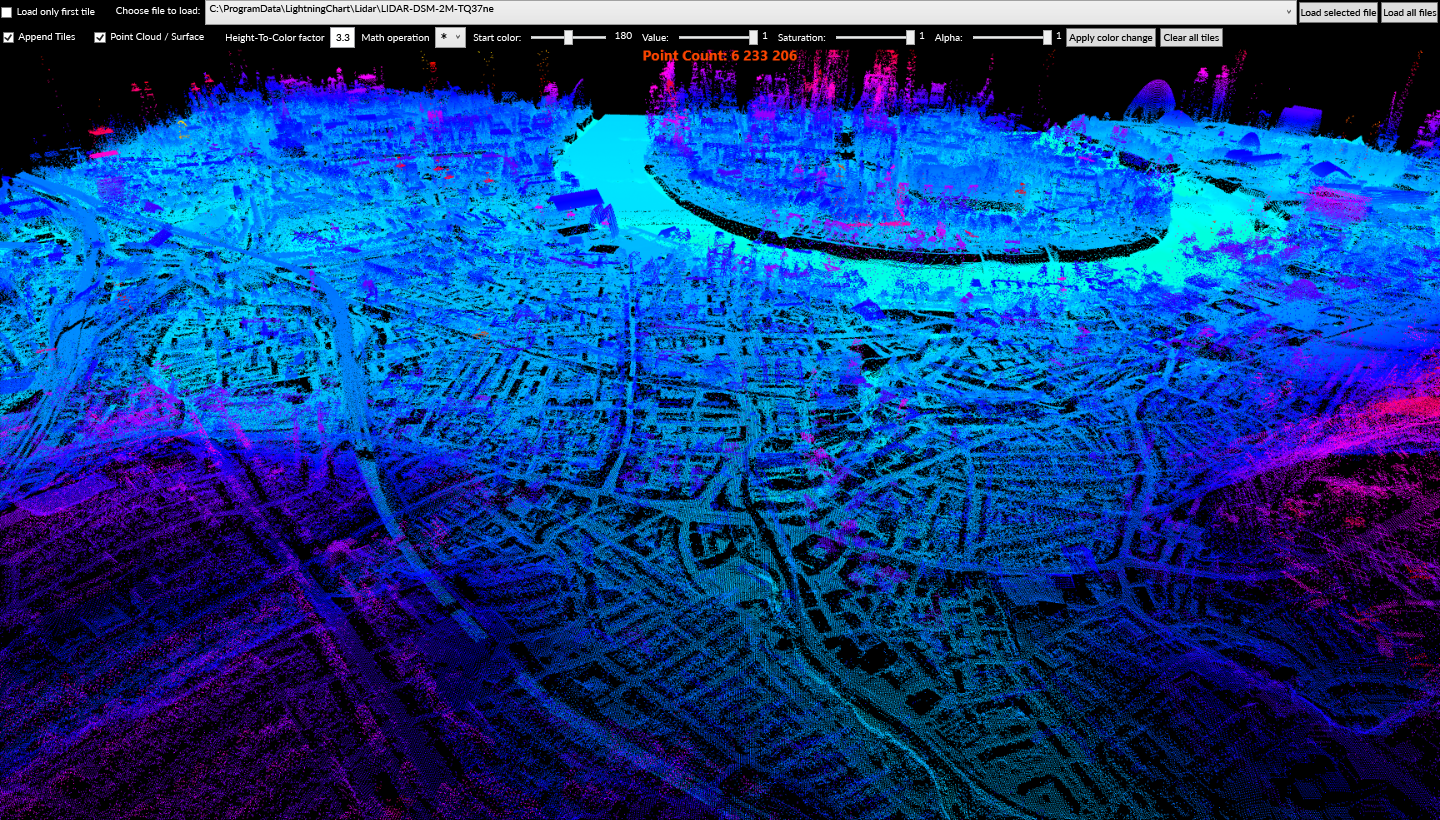 Lidar Lidar | This example shows how you can show Lidar data to SeriesPoint3D or SurfaceGridSeries. In up-panel you can choose append tiles or just show one tile data at once. Relative color of pixels can also be manipulated on fly. | ShowcaseView3DLidarPointCloudPointLineSeries3DCompactPointsColorPointsOptimizationIndividualPointColorsSurfaceGridSeries3D3DXYZTask |
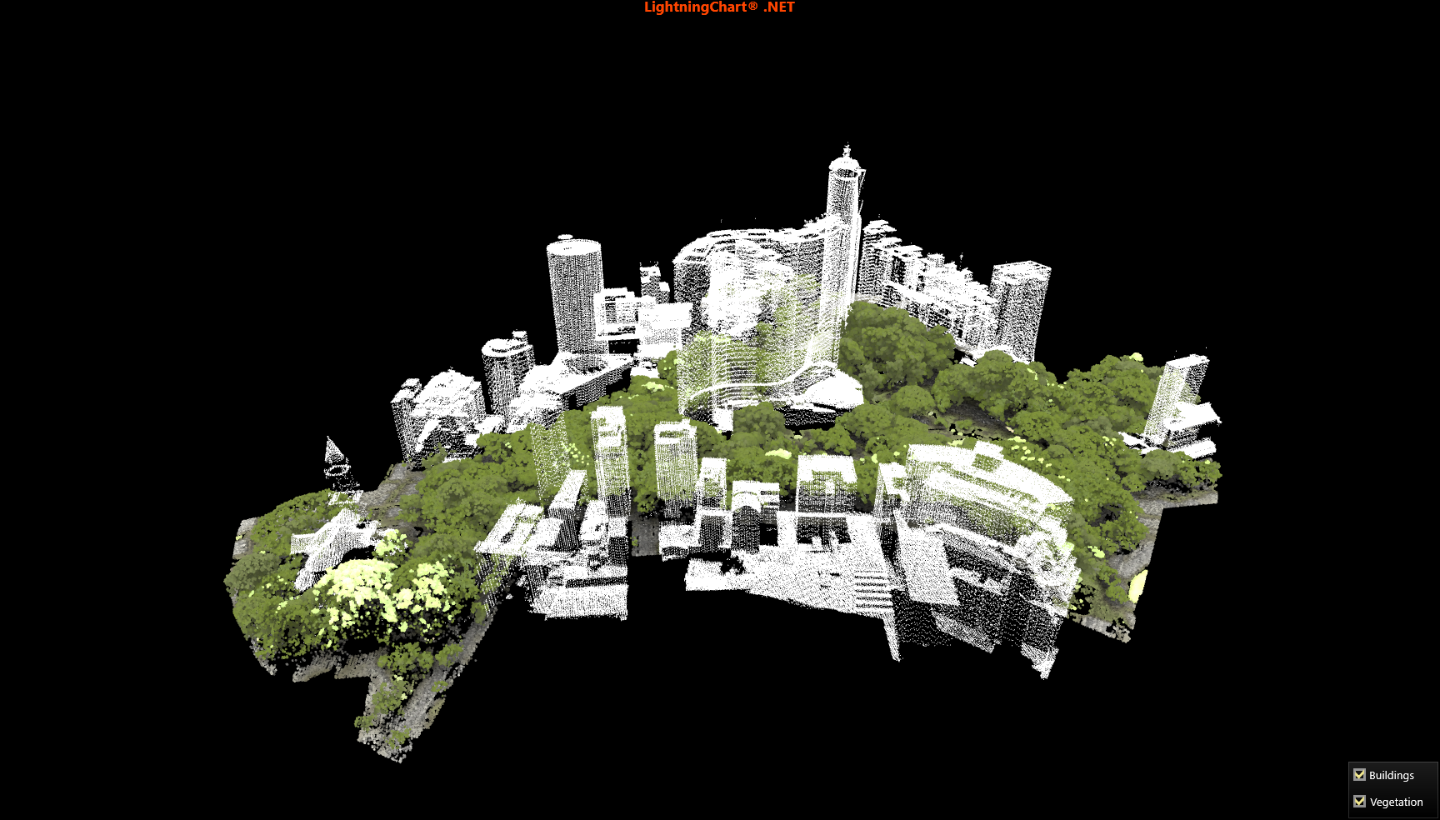 LidarPark LidarPark | This is LiDAR data of a Niemeyer Edificio Copan park in Brasil with 1.437.912 points. LightningChart� .NET is suitable for really fast visualization of LiDAR data sets in range of tens of millions samples, with 3D points or 3D surface. This example shows the approach with points. The LiDAR data points are classified in the source data set between buildings and vegetation, which allows us to separate them into different series. In this example, the building series is colored as solid white colour, while the vegetation is coloured with individual Red, Green and Blue values. Lidar data from: Philipp Urech - Licensed under Creative Commons Attribute. https://sketchfab.com/3d-models/parque-copan-ddfa8cf8aafa4d619e429d9e653ffe81 | ShowcaseLidarView3DPointCloudPointLineSeries3DCompactPointsColorPointsOptimization3DMVVM |
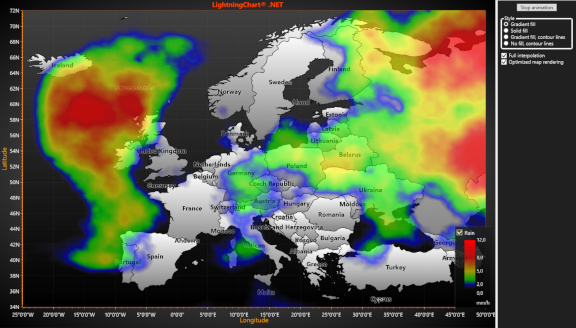 MapEnvironmentalData MapEnvironmentalData | Environmental data simulation with geographical maps and IntensityGridSeries of ViewXY. | Showcase2DViewXYRealtimeStreamingMapWorldGeoGisWgs84HeatmapIntensityGridSeriesWeatherEnvironmentContoursFillGradientPaletteValueRangePaletteColoringRevertAxisRangesCartesianMVVM |
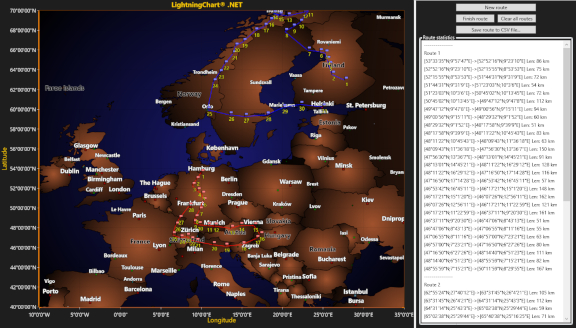 MapRoute MapRoute | Map chart, with routes. Routes are constructed with FreeformPointLineSeries and markers. Way-point distances are calculated with CalculateMapDistance method of ChartTools. | 2DViewXYMapWorldGeoGisWgs84LineFreeformPointLineSeriesRouteMarkersSeriesEventMarkerGraphBackgroundBitmapEditMouseEventsCartesianMVVM |
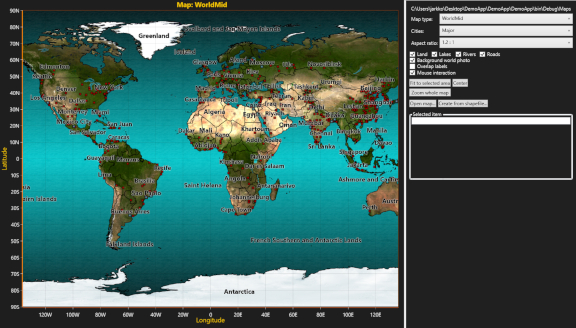 Maps Maps | This example shows maps in Charts | 2DViewXYMapWorldGeoGisWgs84BitmapGraphBackgroundMapBackgroundMapLayerMapTypeMapConverterShapeFileAspectRatioOptionsCartesian |
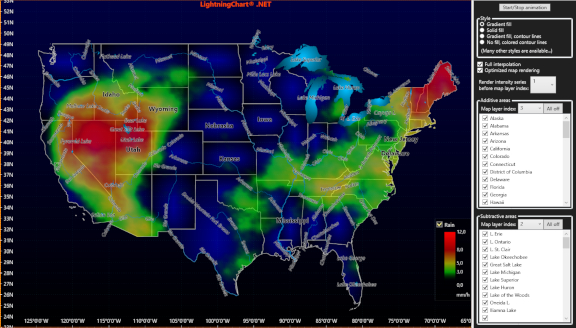 MapStencil MapStencil | Environmental data simulation with geographical maps and IntensityGridSeries of ViewXY. Uses Stencil in series to mask data. | Advanced2DViewXYMapWorldGeoGisWgs84MapLayerHeatmapIntensityGridSeriesRealtimeStreamingAnimationIntensityStencilStencilAreaClipStatesRestrictingPaletteValueRangePaletteColoringCartesian |
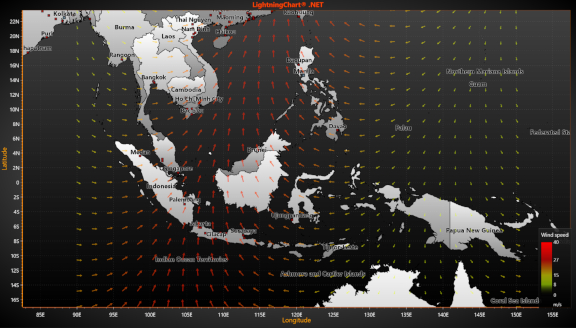 MapWind MapWind | Map and wind data simulation. Annotations are used in Arrow style, and their properties are changed as the data is updated. An empty IntensityGridSeries is used to the color palette in the legend box. | 2DViewXYMapWorldGeoGisRealtimeStreamingAnimationWgs84AnnotationXYArrowWindVectorPaletteValueRangePaletteColoringCartesianMVVM |
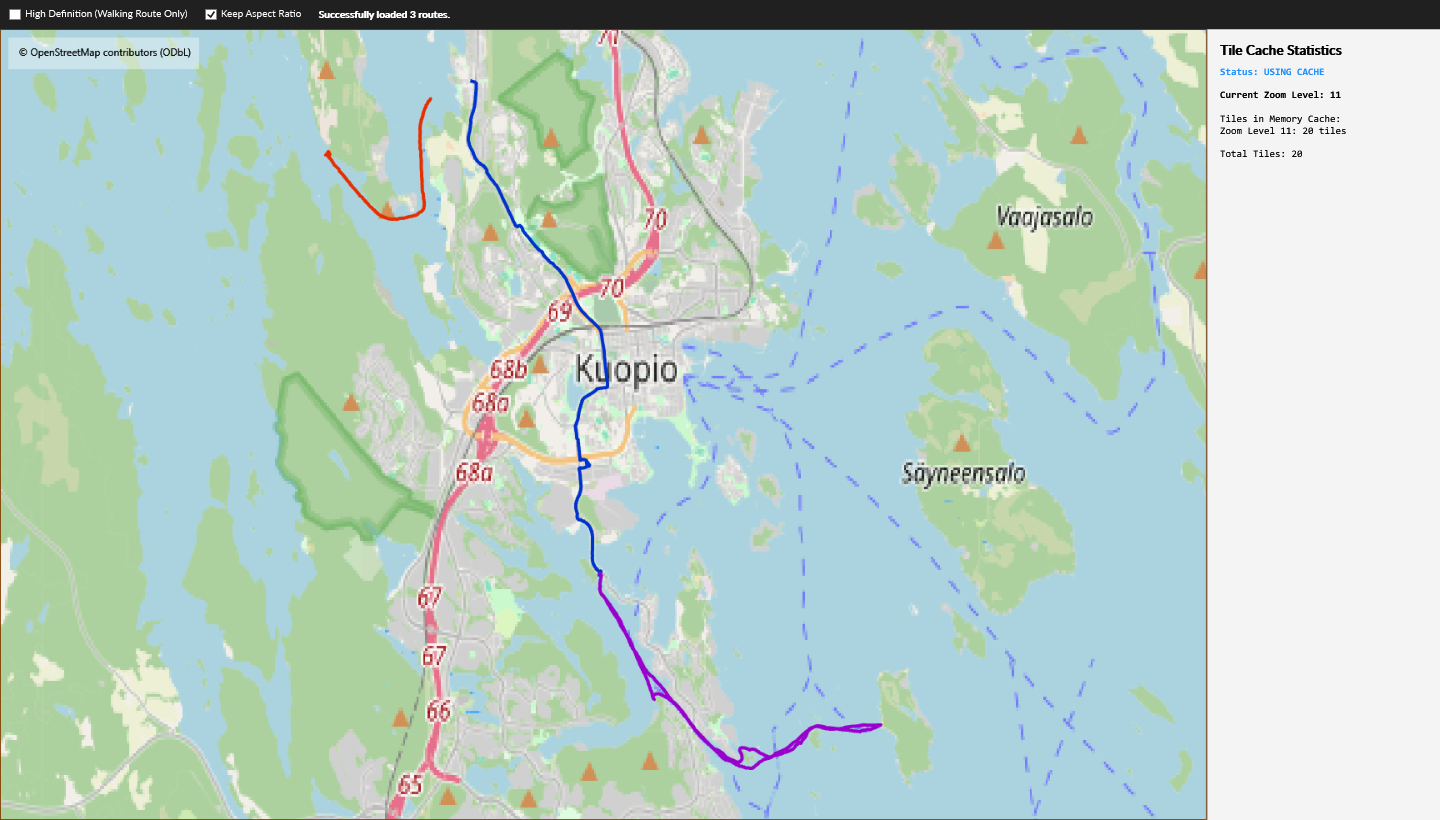 OpenStreetMap OpenStreetMap | This example demonstrates how to create an interactive map using OpenStreetMap (OSM) tiles and LightningChart's ImageLayer. It features dynamic background tile downloading based on the current view, efficient memory caching, dynamic zoom and pan boundaries, and plots GPS routes using LiteFreeformLineSeries. It also includes a High Definition mode with zoom locking and a resilient, multi-threaded tile fetcher to handle network requests smoothly without UI stuttering. | Advanced2DViewXYMapOpenStreetMapImageLayerLiteFreeformLineSeriesGPSTileCacheZoomPanControl |
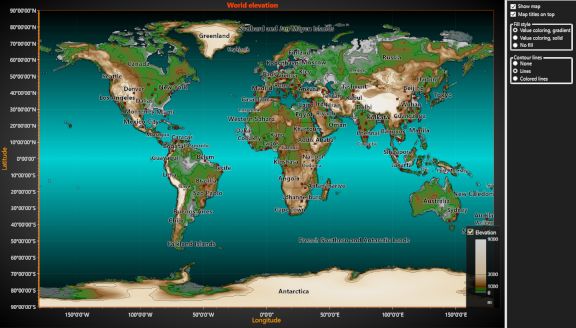 WorldElevationXY WorldElevationXY | World elevation data visualized with IntensityGridSeries of ViewXY. The elevation data is only for demonstration purposes and may be not exactly accurate. | 2DViewXYCartesianMapWorldGeoGisWgs84IntensityElevationHeatmapContoursMVVM |
Heatmaps & Contour Charts12 examples
| Example | Description of example | Tags |
|---|---|---|
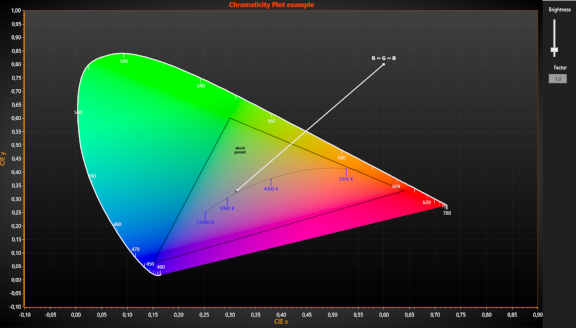 ChromaticityDiagram ChromaticityDiagram | Chromaticity Diagram demo. The CIE 1931 xy chromaticity space. The IntensityGridSeries shaped by Stencil. The CIE xy and sRGB values are shown when mouse Cursor is inside of Spectral locus. Chromaticity's brightness could be changed with track-bar on the right. | 2DViewXYChromaticityIntensityGridSeriesStencilAnnotationPolygonPlanckianGamutMVVM |
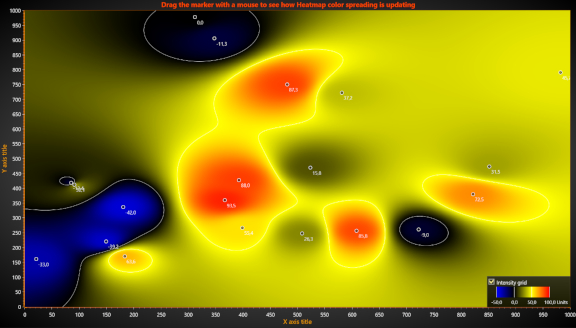 HeatmapColorSpreading2D HeatmapColorSpreading2D | This chart shows you each draggable point has a weight calculated considering location and value. | 2DViewXYCartesianHeatmapIntensityPixelmapPaletteColoringLabelsColorSpreadingMVVM |
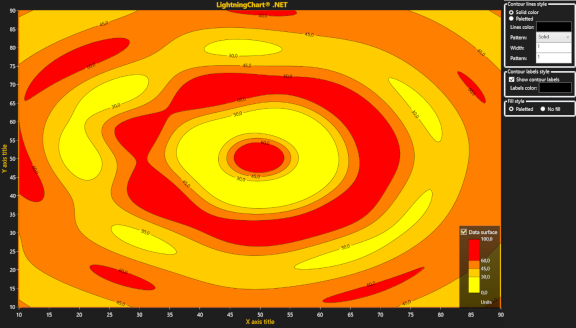 HeatMapContoursWithLabels HeatMapContoursWithLabels | Heat map made with IntensityGridSeries of ViewXY with contour lines and labels. | 2DViewXYCartesianHeatmapIntensityPaletteContourColoringLabelsDataCursorMVVM |
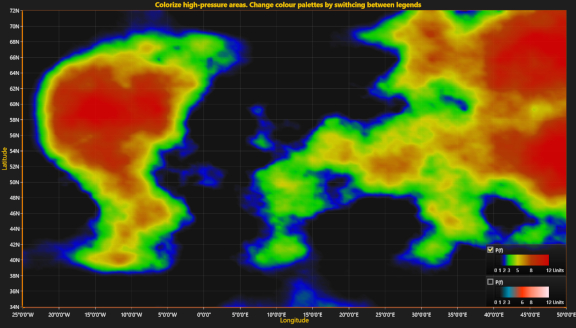 HeatmapWithLegends HeatmapWithLegends | Chart contains several static heatmaps with the same data from Bitmap source, but each series is paletted differently. Change series colouring by swithcing between Legends. | 2DViewXYCartesianTelemetryLegendCarSegmentMVVM |
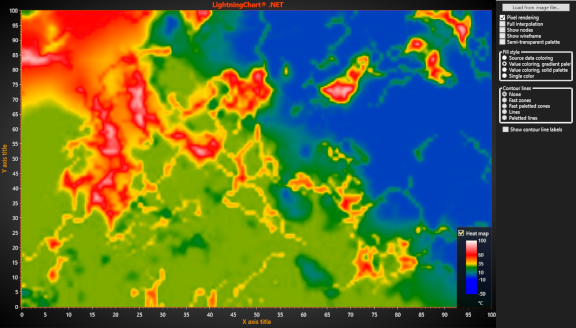 HeatMapXY HeatMapXY | Heat map made with IntensityGridSeries of ViewXY. Zoom closer by dragging with mouse or by using Shift Left mouse button once the data is opened. Pan with right mouse button. | 2DViewXYCartesianHeatmapIntensityPixelmapPaletteColoringLabelsMVVM |
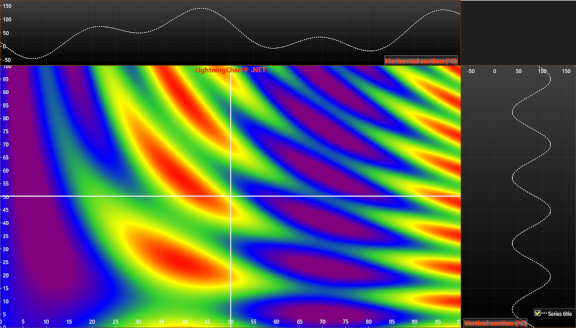 HeatMapXYMouseCrossSection HeatMapXYMouseCrossSection | This chart shows you Heat map made with IntensityGridSeries of ViewXY. | 2DViewXYCartesianHeatmapIntensityMeshPaletteColoringCursorLine |
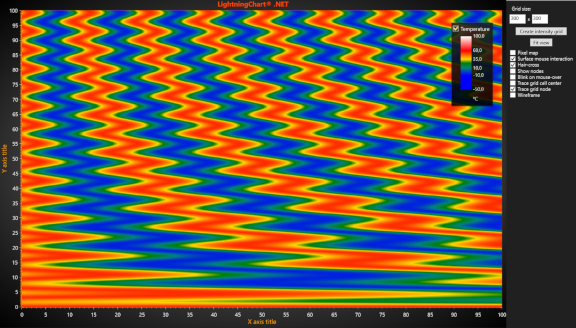 IntensityGridMouseControl IntensityGridMouseControl | Intensity grid series, with mouse tracking options. | 2DViewXYCartesianHeatmapMouseEditIntensityPixelmapSolveAnnotationPaletteColoringMVVM |
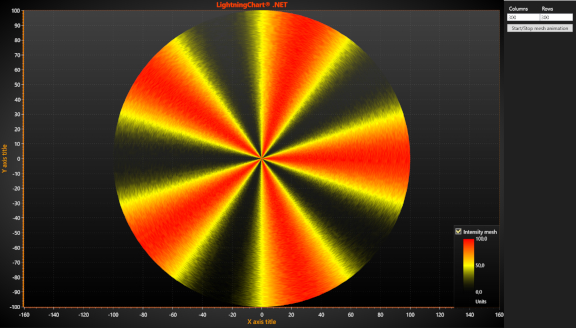 IntensityMeshCircle IntensityMeshCircle | Intensity mesh, circle-form static geometry, but continuously updated values. | 2DViewXYArtesianPolarHeatmapMouseEditIntensityMeshStaticPaletteColoringMVVM |
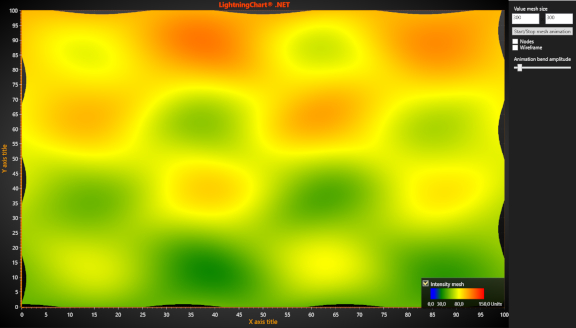 IntensityMeshStaticPositions IntensityMeshStaticPositions | Intensity mesh, with static geometry, but continuously updated values. Demonstrates the IntensityMesh.Optimization: DynamicValuesData. | 2DViewXYCartesianHeatmapMouseEditIntensityMeshStaticPaletteColoringMVVM |
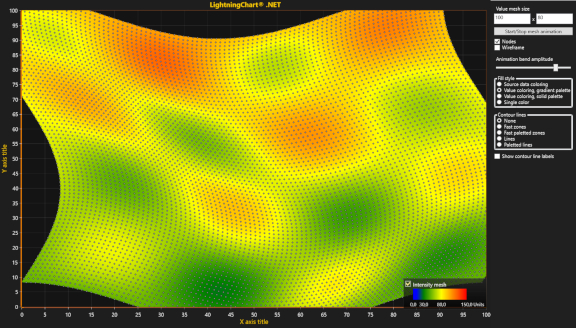 IntensityMeshXY IntensityMeshXY | Intensity mesh, presented by IntensityMesh series of ViewXY. Each node can be assigned X, Y and Intensity value. | 2DViewXYCartesianHeatmapIntensityMeshPaletteColoringLabelsMVVM |
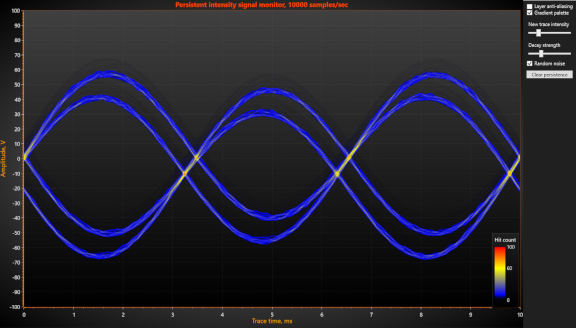 PersistentIntensitySignal PersistentIntensitySignal | Persistent intensity series rendering layer example, with signal data. Higher hit counts produce higher value in the 'heat map'. | 2DViewXYPersistentLayerIntensityHeatmapPointCounterPaletteRenderSeriesColoringSignalPersistentSeriesRenderingIntensityLayerSignalGeneratorSampleDataSeriesPersistenceRepetitiveFadingCartesianMVVM |
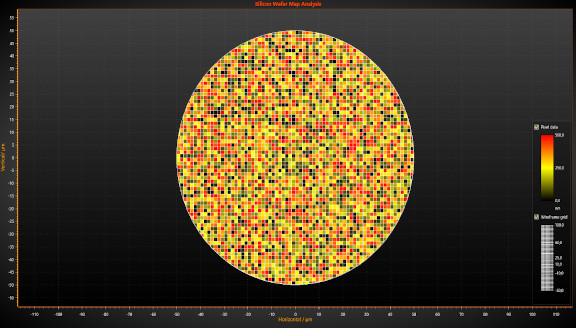 SiliconWaferMap SiliconWaferMap | Substrate mapping or 'wafer mapping' is a process in which the performance of semiconductor devices on a substrate is represented by a map showing the performance as a colour-coded grid. | ViewXYWaferSiliconIntensityIntensityGridSeriesPolygonSeriesStencilPixelPixelRenderingWireframeMVVM |
3D Surface Charts15 examples
| Example | Description of example | Tags |
|---|---|---|
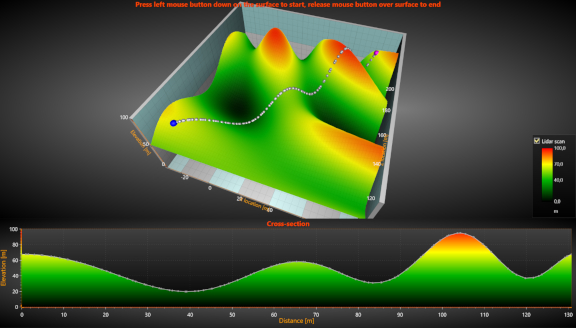 CrossSectionSurface3D CrossSectionSurface3D | 3D surface cross-section between two points, solving of the grid intersections, and displaying them in height-colored 2D chart below. | AdvancedView3D2DSurfaceCross-sectionViewXYCartesianAreaLinePointsShowcaseDataCursorMVVM |
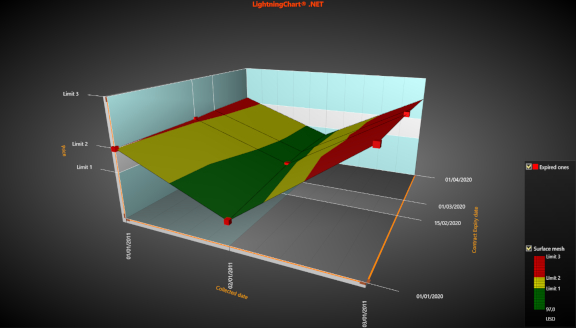 CustomTicks3DSurface CustomTicks3DSurface | 3D chart with custom axes ticks. DateTime axes values are used, and the values are un-evently spaced on data and axes. | AdvancedView3DXYZSurfaceGridContourPaletteColoringTradingCustomticksCustomTicksIntervalsMVVM |
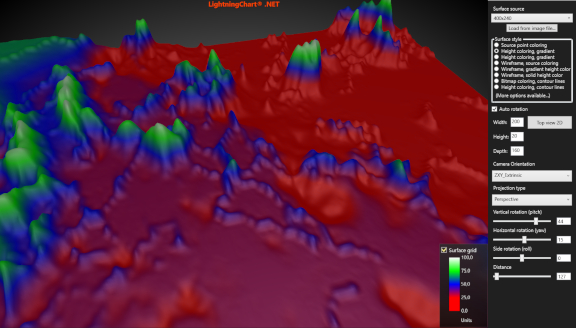 LargeSurface LargeSurface | SurfaceGridSeries demonstration. Opens surface from file and generates height data from it. | AdvancedView3DXYZSurfaceGridContourPaletteColoringElevationFileLoadingBitmapLargeWorld |
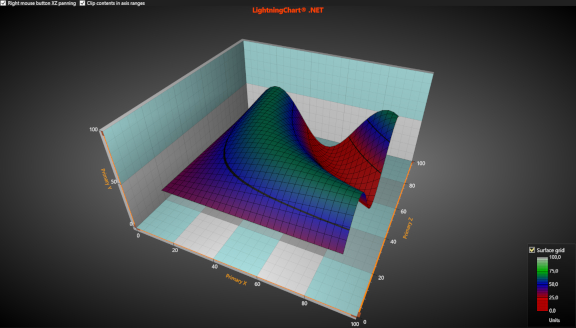 SimpleSurfaceGrid3D SimpleSurfaceGrid3D | Simple surface grid 3D example. Pan the view with right mouse button. | BasicsView3DSurfaceSurfaceGridSeries3DContourPaletteWireframeDataCursorXYZMVVM |
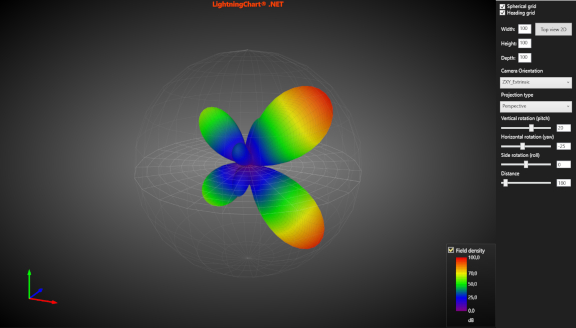 SphericalSurfaceMesh3D SphericalSurfaceMesh3D | Spherical coordinates in View3D. Uses a spherical-Cartesian converter. Data is shown with a SurfaceMeshSeries3D. Move mouse over the series to show spherical values. If using left-hand-side system, set ZAxisPrimary3D.Reversed = true. | AdvancedView3DSurfaceSurfaceMeshSeries3DAnnotationPalettedByValueWireframeSphericalSphericalCartesian3DHeadingPolarXYZMVVM |
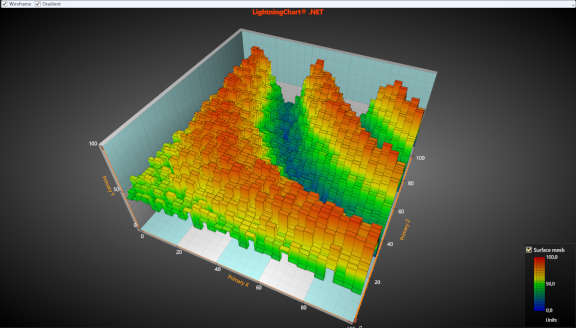 SteppingMesh3D SteppingMesh3D | Stepping surface mesh. 2D array of Y values are presented as stepping SurfaceMeshSeries3D data. | BasicView3DSurfaceSurfaceMeshSeries3DSteppingPaletteDataCursorMeshXYZMVVM |
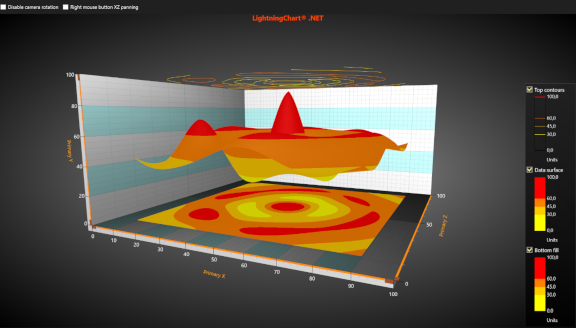 SurfaceFlatContourProjection SurfaceFlatContourProjection | 3D surface, with flat contours projections on top and bottom. | View3DXYZSurfaceSurfaceGridSeries3DPalettedByValuePalettedByYContourProjectionFlatGridMVVM |
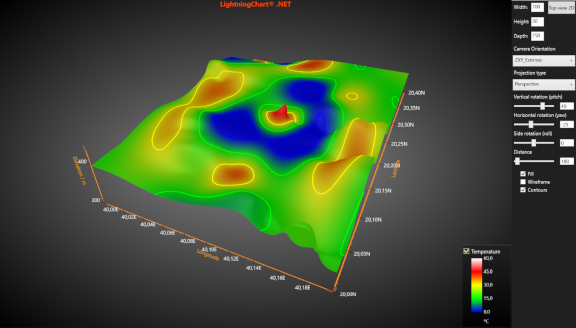 SurfaceGridValueColored SurfaceGridValueColored | 3D surface grid series, with coloring and contouring by Value field of SurfacePoints | View3DSurfaceSurfaceGridSeries3DContourPalettedByValueColoringElevationValueGridWireframeMVVM |
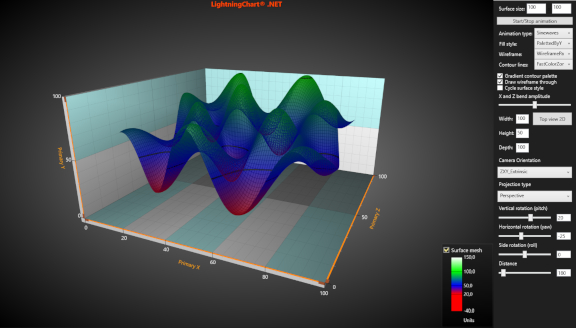 SurfaceMesh3D SurfaceMesh3D | Surface mesh demonstration. X,Y and Z values can be defined for each mesh point, allowing uneven node spacing. Change surface styles to use different fills, wireframe, contour palette and zones. | AdvancedView3DXYZSurfaceSurfaceMeshSeries3DAnimationPaletteColoringWireframeContourFillMeshMVVM |
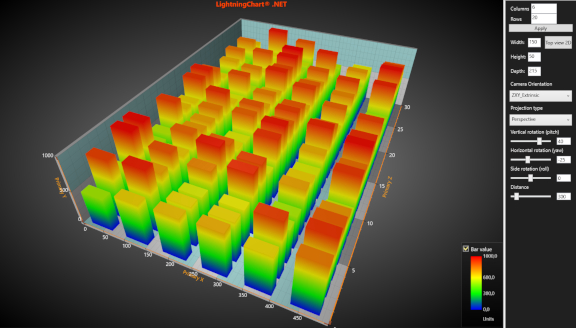 SurfaceMeshBars SurfaceMeshBars | Gradient 3D bars, made with SurfaceGridSeries3D objects. BarSeries3D does not support gradient coloring, so it must be done this way. | View3DXYZSurfaceSurfaceMeshSeries3DAnimationPaletteColoringBarsMeshScrollingMVVM |
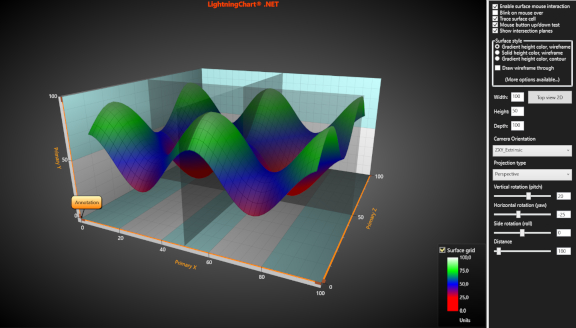 SurfaceMouseControl SurfaceMouseControl | Surface grid series and walls mouse hit test demo. Annotation shows the surface cell number and its value. If the mouse is over surface series, it automatically prevents the model rotation and panning. If mouse is over a wall, mouse rotation and panning is possible. | AdvancedView3DXYZSurfaceRectangleAnnotationSurfaceGridSeries3DTrackingTraceCellChangedGridMousePalettedByYIntersectionMVVM |
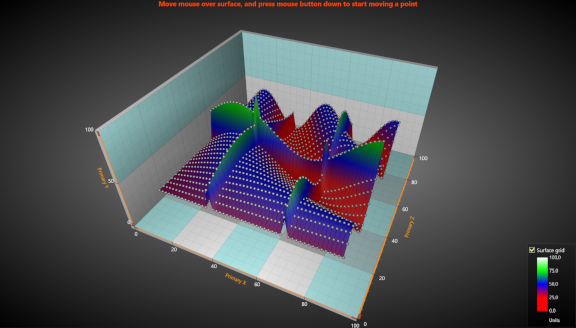 SurfaceMouseEdit SurfaceMouseEdit | Surface values editing by mouse. Press mouse left button and drag up / down. | View3DXYZSurfacePointsTrackingEditingMovePointPalettedByYSurfaceGridSeries3DPointLineSeries3DMVVM |
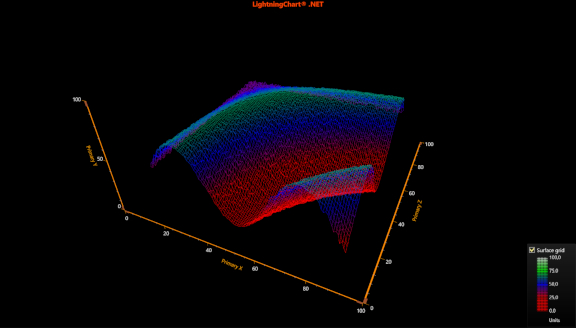 SurfaceNearestPointTracking SurfaceNearestPointTracking | Surface grid series with nearest data point tracking. Wireframe shown and fill not applied. Move the mouse over the surface to see the tracking point. | BasicView3DXYZSurfaceTrackingGridPaletteWireframeSurfaceGridSeries3DPointLineSeries3DIndicatorMarkerMVVM |
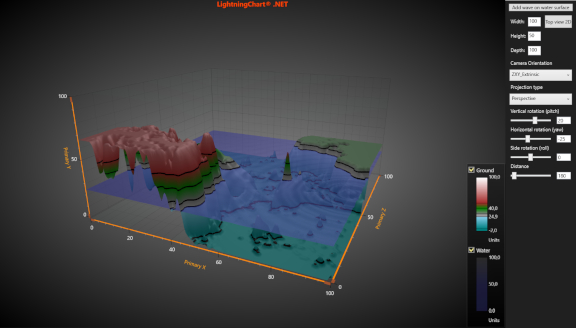 SurfaceWater3D SurfaceWater3D | SurfaceGridSeries animation demonstration. Nodes are evenly spaced in Grid surface. Y value can be set for each node. Terrain is generated from bitmap image color data. Wave height data is calculated from oscillator outputs. | AdvancedView3DSurfaceGridAnimationContourPaletteLight3DElevationBitmapSurfaceGridSeriesMVVM |
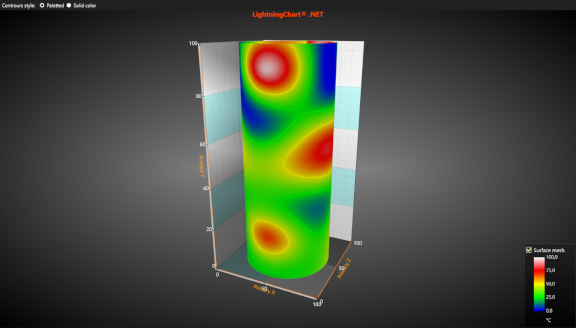 ValueBased3DContouring ValueBased3DContouring | Surface mesh demonstration shows heat dissipation in a pipe, or strain of 3D object. Using contour palette and zones the most critical parts can be distinguished. | View3DXYZSurfaceMeshPaletteColoringWireframeContourFillValue4DMVVM |
3D Points & Mesh Models19 examples
| Example | Description of example | Tags |
|---|---|---|
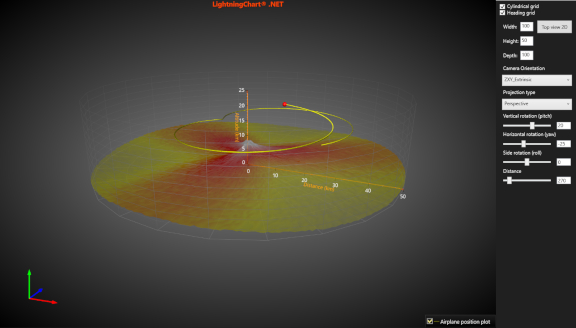 Cylindrical Cylindrical | Cylindrical coordinates in View3D. Uses a cylindrical-cartesian converter. Data is shown with PointLineSeries3D and terrain with SurfaceMeshSeries3D. Move mouse over the line plot to show cylindrical values. | AdvancedView3DXYZCylindricalLinePoint-linePolarSurfaceMeshMVVM |
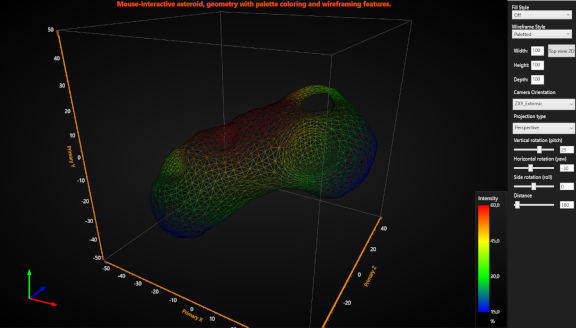 MeshModelAsteroid MeshModelAsteroid | MeshModel with custom coloring based on vertex distance to a point. Move mouse over the asteroid to track the nearest triangle in the model. | AdvancedXYZSurfacePaletteColoringCadModelMeshModelMeshGeometryConstructedUpdateFillColorsUpdateWireframeColorsImportObjMouseIndicatorAnnotationTrackingTracingTrackTriangleTriangleTracedPointLineSeries3DAnnotation3DMVVMView3D |
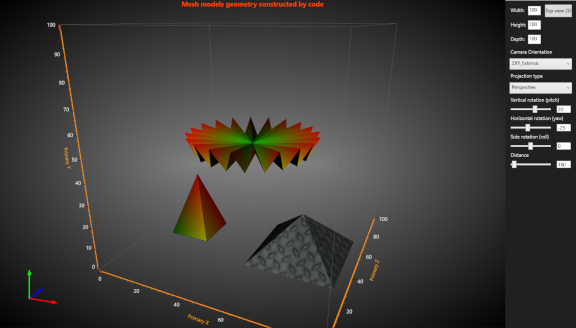 MeshModelByCode MeshModelByCode | Mesh models geometry constructed by code. | AdvancedView3DXYZCadModelMeshModelMeshImportDataCursorObjMVVM |
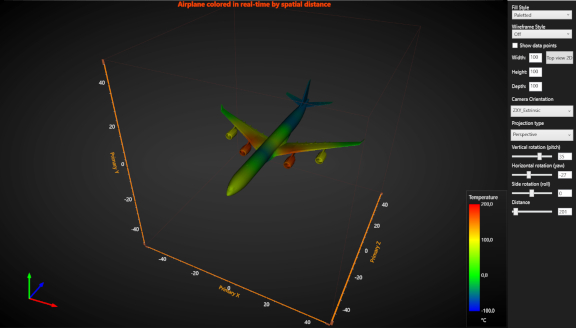 MeshModelRealtimeColoring MeshModelRealtimeColoring | MeshModel with custom coloring with live updates. | AdvancedShowcaseView3DXYZSurfacePaletteColoringRealtimeAnimationstreamingCadModelMeshModelGeometryConstructedUpdateFillColorsUpdateWireframeColorsValueRangePalettePointLineSeries3DIndividualPointColorsImportObjOrientationArrowsPlaneMVVM |
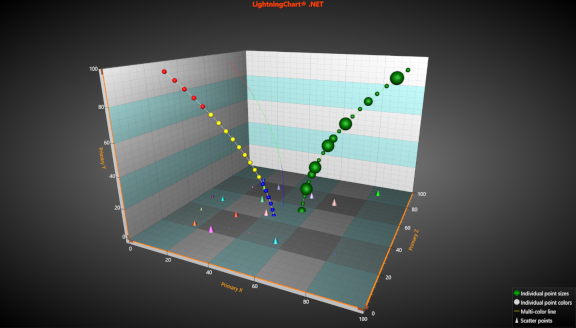 MultiColoredPointLineSeries3D MultiColoredPointLineSeries3D | Multi-colored 3D point-line series example. Demonstrates multi-colored line and individual points coloring and their sizes. | AdvancedView3DXYZMultiColoringScatterLinePointLineSeries3DIndividualPointSizesIndividualPointColorsMultiColorLineSizingMVVM |
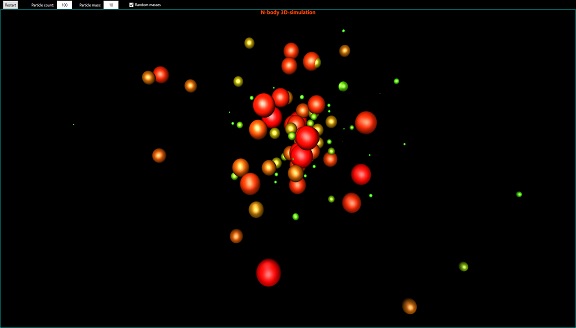 NBodySimulation3D NBodySimulation3D | Three dimensional N-body simulation, where particles move based on gravitational forces. Random particle masses colored and scaled individually. The forces between the particles are calculated using direct method: each particle calculates the forces between every other particle, then sums them. Powerful, multi-core processors allow showing more particles. | Animation3DView3DScatterPointsPointLineSeries3DColoringSizingRealtimeIndividualPointSizesIndividualPointColors |
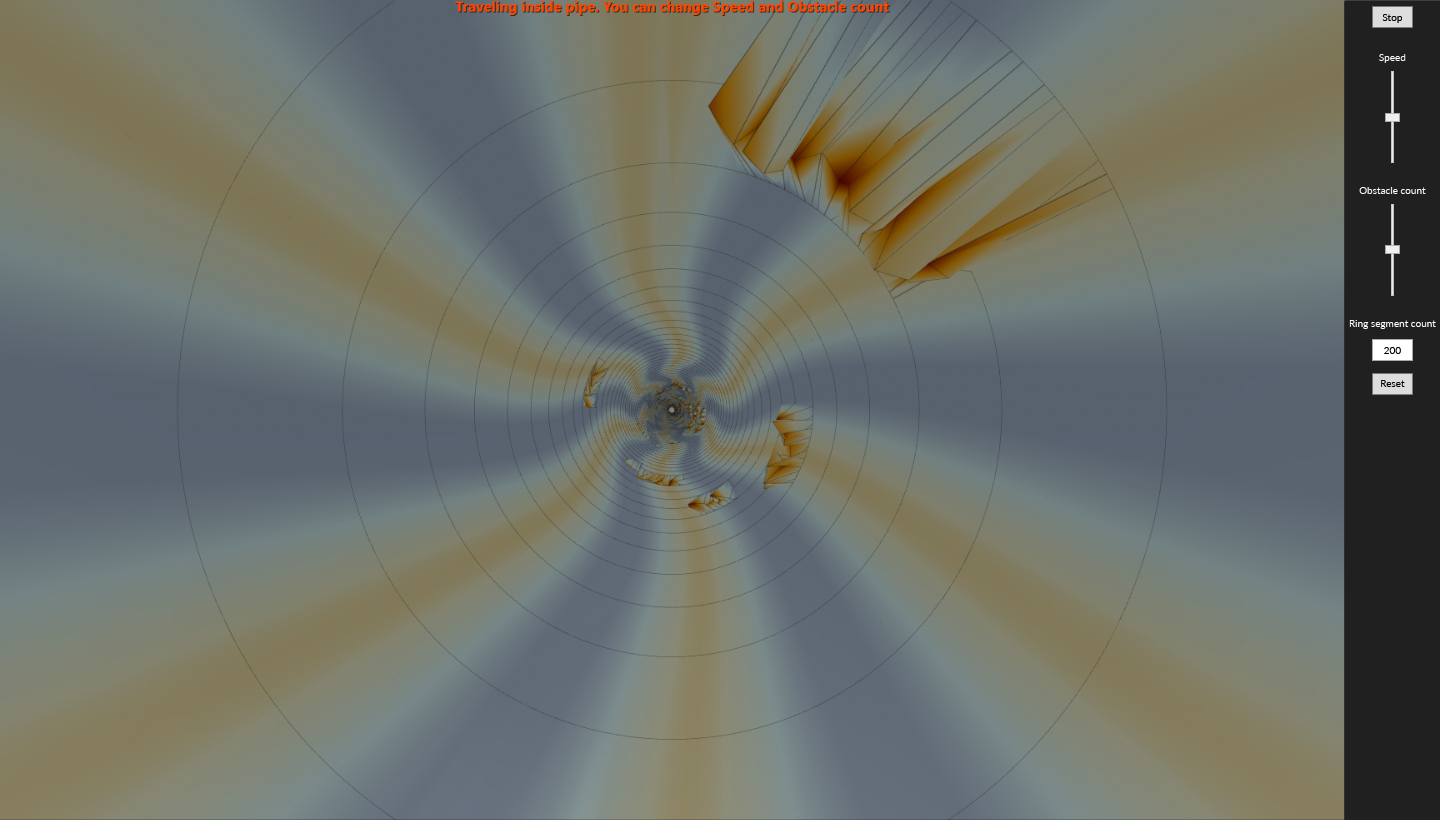 PipeInterior PipeInterior | Pipe interior visualization. SurfaceMeshSeries3D is used to create the pipe while InsertColumnBack -method is used to generate the movement. Column count can be changed to modify the precision/sharpness of the pipe. | AnimationView3DXYZSurfaceSurfaceMeshSeries3DPalettePalettedByValueInsertColumnBackColoringRealtimeStreamingWireframe |
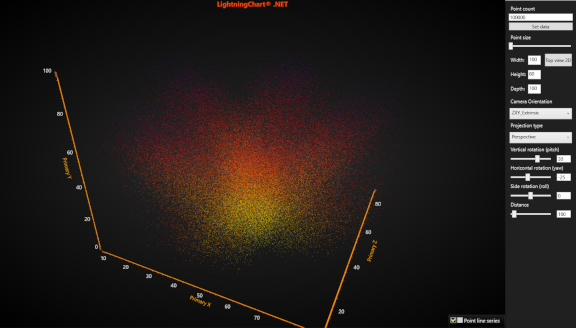 PointCloud3D PointCloud3D | Point cloud visualization with SeriesPointCompactColored3D. Colors for points are calculated using fixed interval palette. | View3DXYZCloudPointsScatterPointLineSeries3DIndividualPointColorsCompactPointsColorPointsCompactColoredLargeLotsVastParticlePaletteColoringDataCursorMVVM |
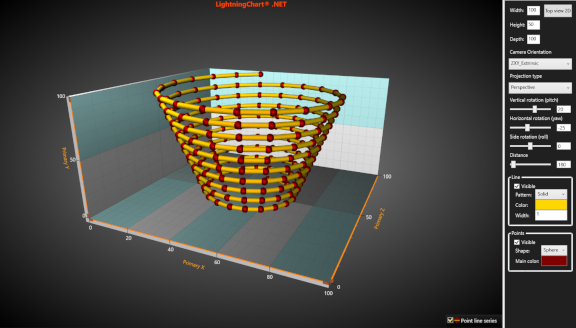 PointLines3D PointLines3D | 3D point line series example. It demonstrates various line styles and coloring. | View3DXYZLinePointLineSeries3DPointsDataCursorDiffuseColorLineStylePatternDimensionsMVVM |
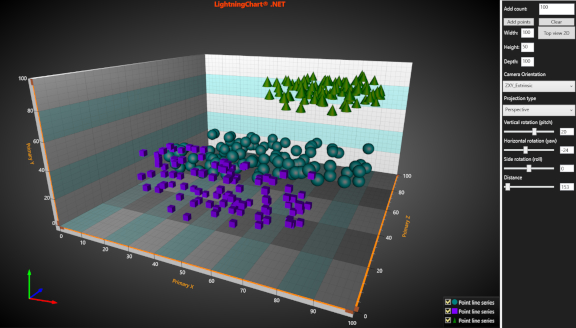 Points3D Points3D | Scatter chart 3D with PointLineSeries3D. | BasicView3DXYZScatterPointsPointLineSeries3DSpecularColorDiffuseColorOrientationArrowsMVVM |
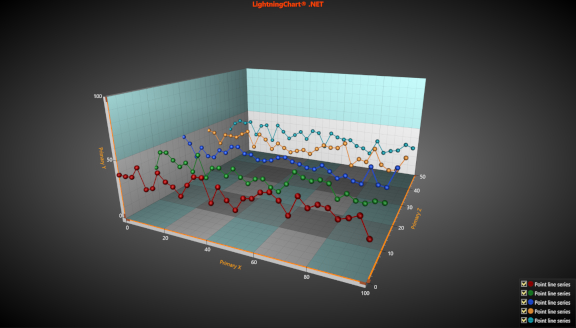 PointTracking3D PointTracking3D | Point tracking example in 3D. Solves the point at mouse position, and displays its value in an annotation. Shows GetActiveUserInteractiveDeviceOverObject usage. | BasicView3DLinePointsTrackingMouseAnnotationPointLineSeries3DLastHitTestIndexXYZMVVM |
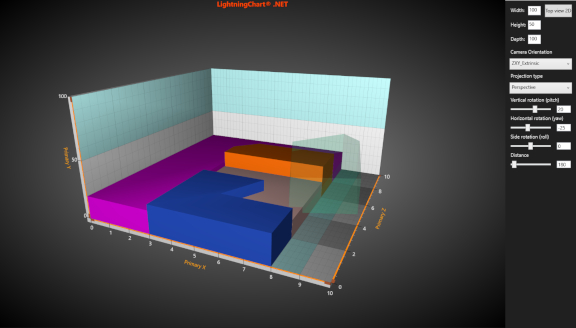 Polygons3D Polygons3D | 3D polygons example shows how to draw 3D blocks of different shape. | BasicsView3DXYZPolygon3DPlaneMVVM |
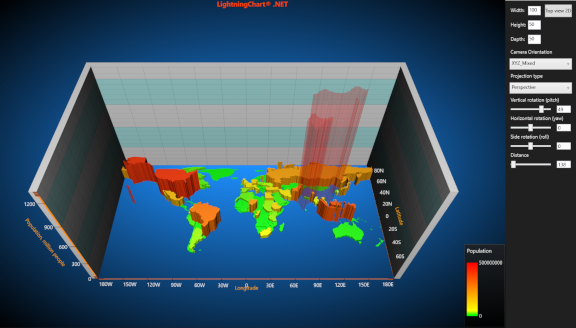 PopulationPolygons3D PopulationPolygons3D | Countries colored by population. Country borders and height visualized with Polygon3D objects. When clickred on Polygon3D, MessageBox is shown. | View3DXYZPolygon3DMapPopulationBarsStatisticMapCoordsDegNESWRegionLayerPaletteMVVM |
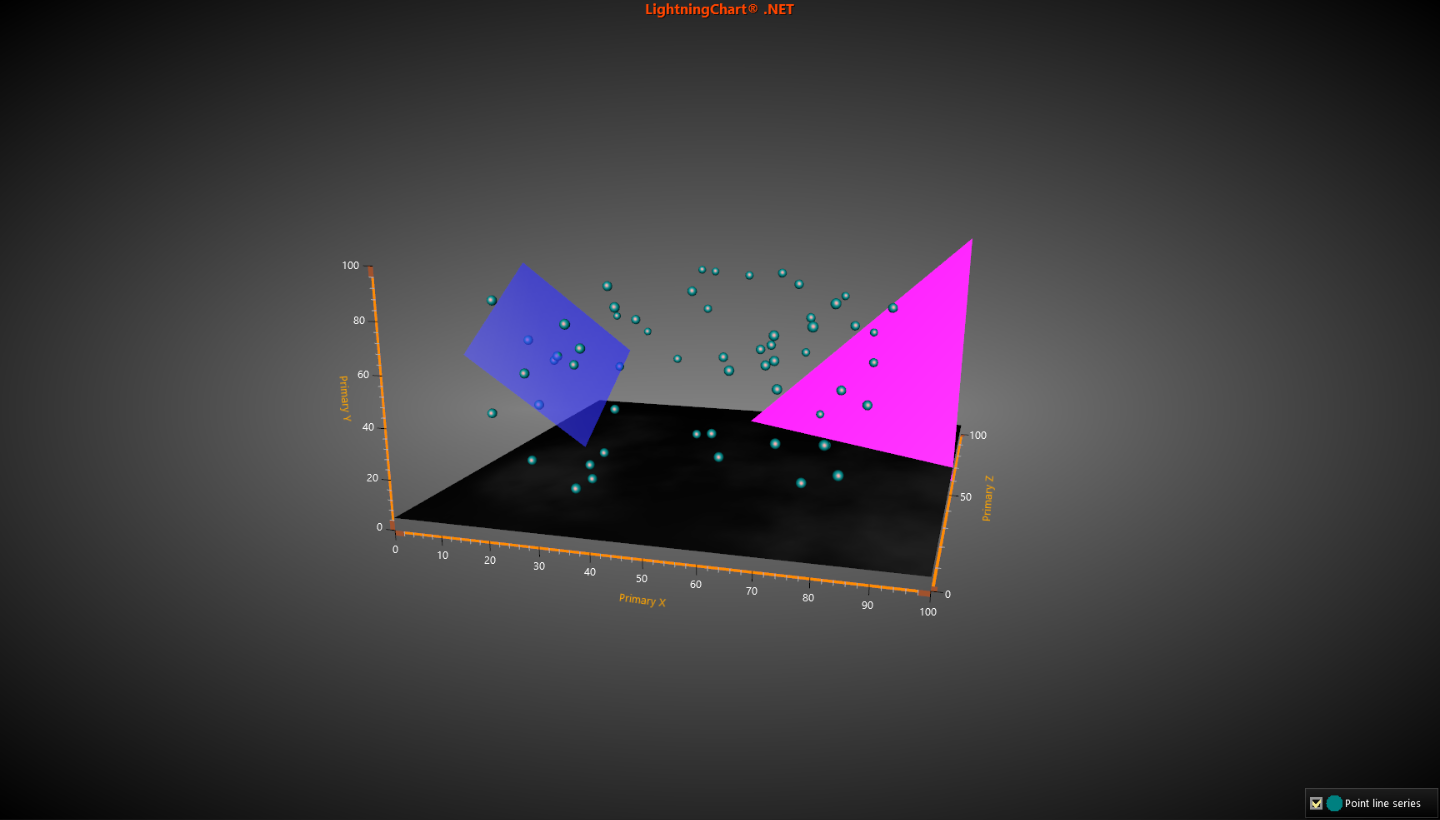 Rectangle3D Rectangle3D | Rectangle3D objects can be positioned freely in 3D space, used as rectangles or planes and filled with color or bitmap. | BasicsView3DXYZRectangleRectangle3DPlaneBitmapUseImageClipContentsPointLineSeries3DMVVM |
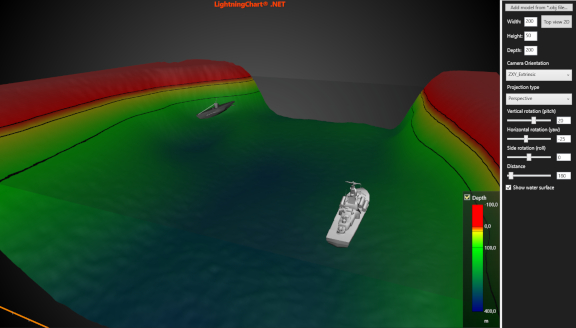 SeaMeshModels SeaMeshModels | SurfaceGridSeries is used for the bottom of the sea and water surface. MeshModel objects is used to show the vessels. | ShowcaseView3DXYZSurfaceMeshModelSurfaceGridSeries3DContourCadModelLoadFromFileSetHeightDataFromBitmapPaletteColoringMVVM |
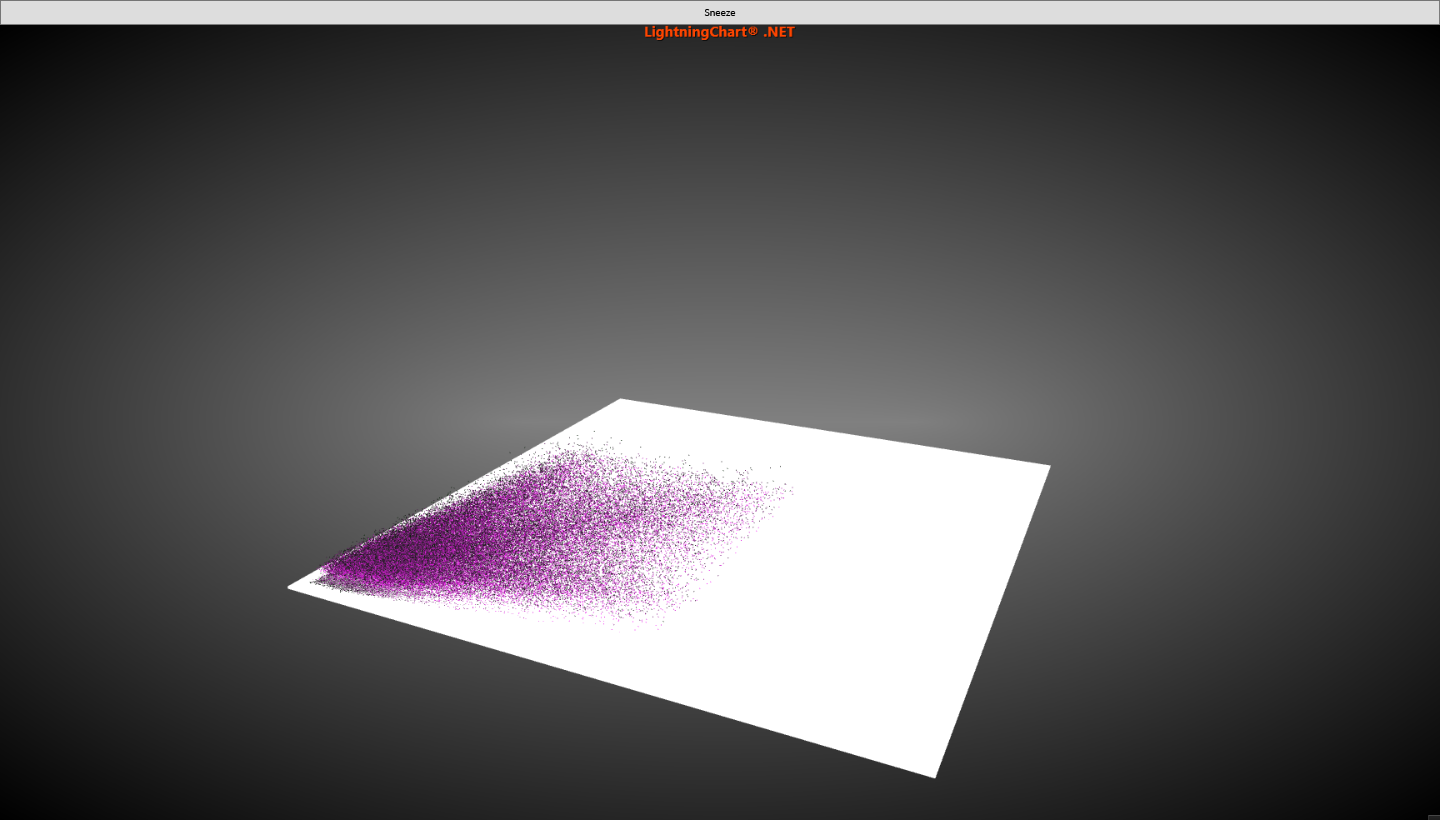 SneezeSimulation SneezeSimulation | Shows "Sneeze" simulation shows points-cloud spreading as function of weight and speed. PointLineSeries3D with PointsOptimization is used. The data values are random, therefore, not scientifically accurate. | 3DView3DSimulationRealtimePointsCloudAnimationPointlineSeries3DIndividualPointColorsPointsOptimizationSneeze |
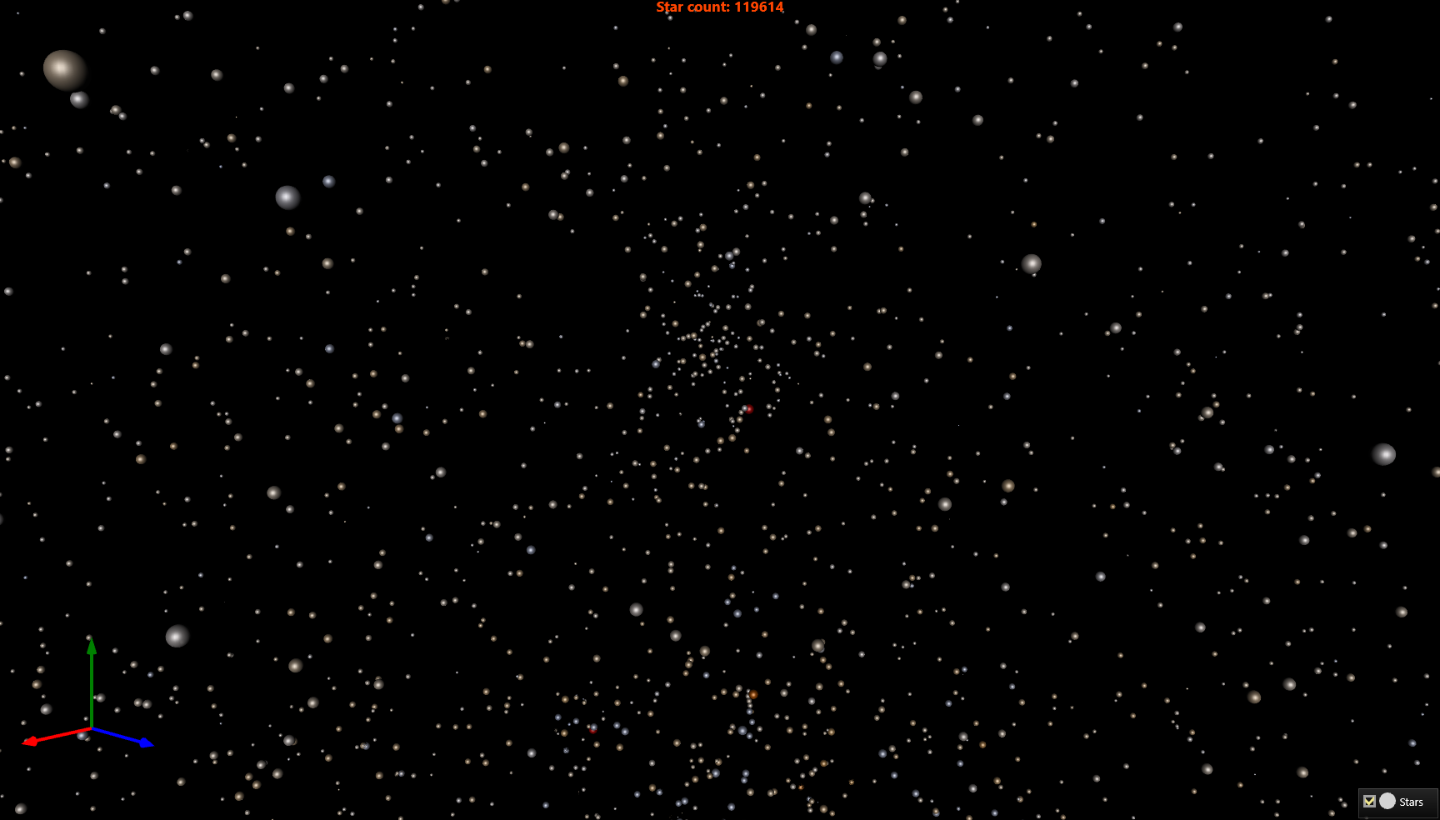 StarMap StarMap | HYG stellar database. The Cartesian coordinates of the star, in a system based on the equatorial coordinates as seen from Earth. Animation tracks stars' position change in time. | 3DView3DStarsAnnotationAnimationPointLineSeries3DIndividualPointColorsIndividualPointSizesCloudPointsCartesian |
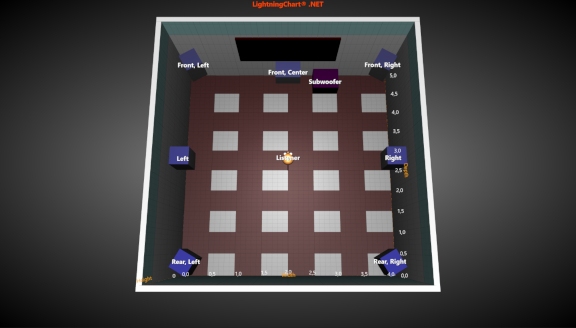 SurroundRoom3D SurroundRoom3D | Surround sound system represented with PointLineSeries3D. | BasicView3DXYZPointStylePointLineSeries3DMVVM |
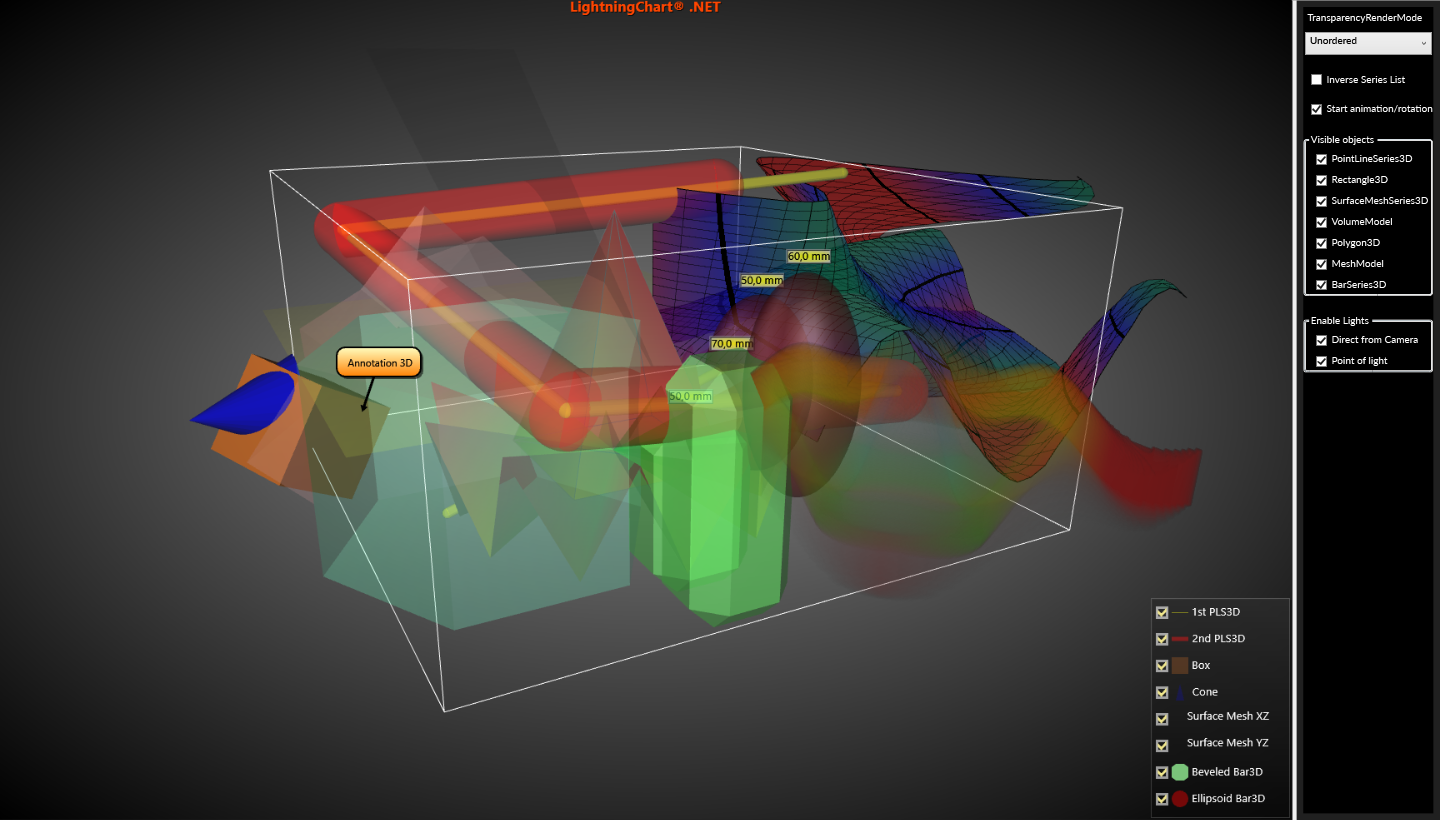 TranslucentChart3D TranslucentChart3D | All types of 3D series in translucent colors. In this example all View3D series demonstrated with particular emphasis on how translucent objects are rendered. In most cases it is enough just to make Series color semi-transparent, and it is possible to see through 3D object. However, Unordered TransparencyRenderMode will have some occasional artifacts under certain angles. To resolve those artifacts ShaderApproximation should be used. | View3DXYZAdvancedTransparencyRenderModeTransparentSurfacePaletteCadModelMeshmodelPointLineSeries3DRectangle3DSurfaceMeshSeries3DVolumeModelPolygon3DBarSeries3DAnnotation3DFrameBoxLightsSupplyCustomValueStringShaderApproximationTranslucentSemiTransparentMesh |
Scatter & Bubble Charts9 examples
| Example | Description of example | Tags |
|---|---|---|
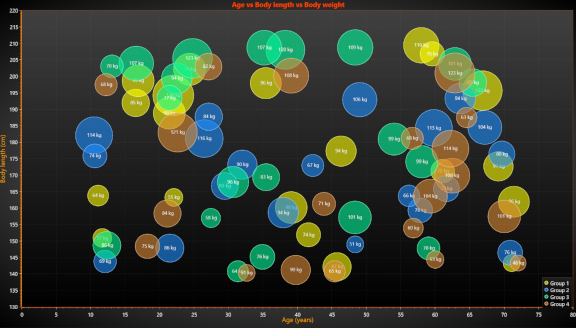 Bubbles Bubbles | Example of how to make bubble chart with SeriesEventMarkers. Bubble chart shows 3-dimensional data: X, Y and 3rd as bubble size. | 2DViewXYCartesianBubblePointsFreeformMarkerMVVM |
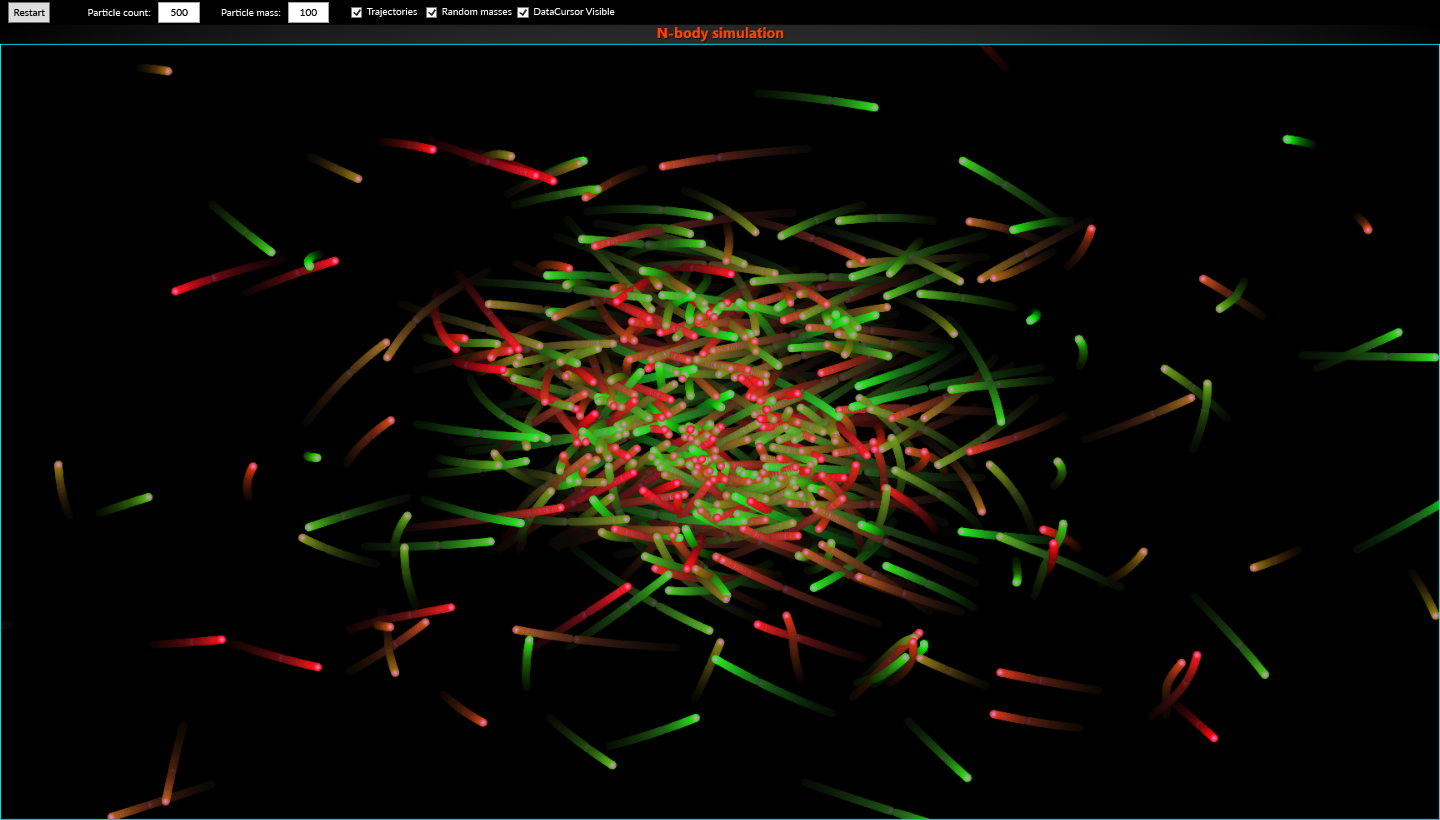 NBodySimulation NBodySimulation | N-body simulation, where particles move based on gravitational forces. The forces between the particles are calculated using direct method: each particle calculates the forces between every other particle, then sums them. Powerful, multi-core processors allow showing more particles. Particle trajectories, made by using PersistentRenderingLayer, can also be applied. | Animation2DViewXYScatterFreeformPointIndividualPointColoringPersistentPersistentSeriesRenderingLayerRenderSeriesPersistenceRealtimeStreamingDataCursorShowcaseCartesian |
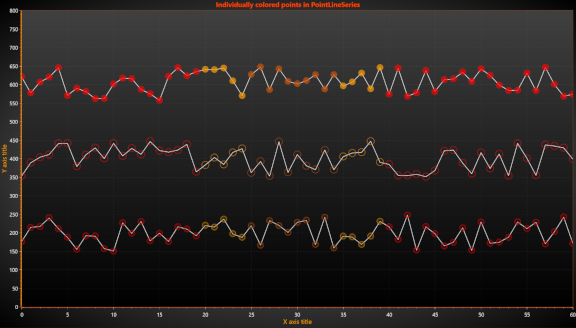 PointsColoringXY PointsColoringXY | This example shows you individually colored points. Color field of SeriesPoint can be applied to Color1, Color2, Color3 or BorderColor of series' PointStyle. | Basic2DViewXYPointsIndividualPointColoringColoringBorderColorCartesianMVVM |
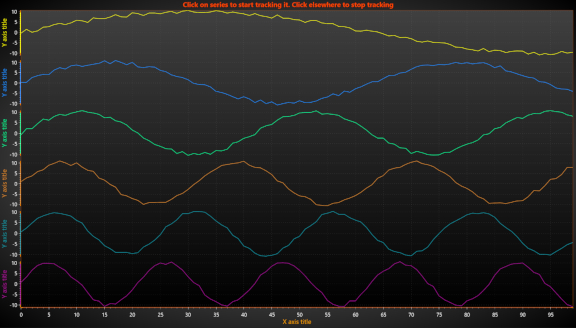 PointTracking2D PointTracking2D | Multi-channel tracking with focus on one. Click on the series to track values. Click elsewhere to stop tracking. | 2DViewXYLineAnnotationPointLineSeriesSolveIsPositionOverTrackStackedMouseCartesianMVVM |
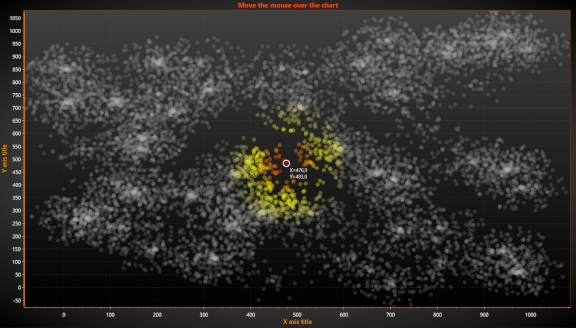 ScatterColoringByDistance ScatterColoringByDistance | In this example the nearest data point to mouse coordinate is found. Applying color for points based on distance from mouse. | 2DViewXYPointsScatterFreeformPointLineSeriesIndividualPointColoringValueRangePaletteGetColorByValueTrackingMarkerCartesianMVVM |
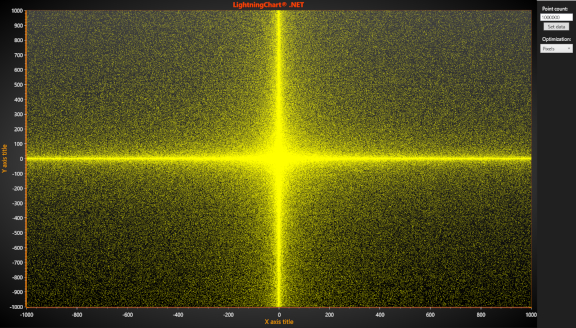 ScatterLotsOfDots ScatterLotsOfDots | This example shows you lots of scatter dots, implemented with FreeformPointLine series. PointsOptimization property of the series introduced. | Basic2DViewXYScatterCloudPointsOptimizationFreeformPointLineSeriesDotLotsLargeCartesianMVVM |
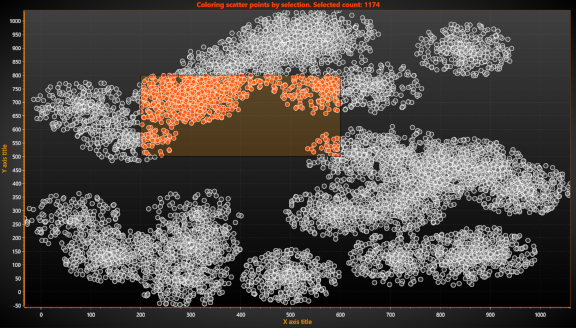 ScatterPointsIndividualColored ScatterPointsIndividualColored | Individual colored scatter points. Selection box applies new colors for the points inside the box. | 2DViewXYScatterAnnotationFreeformPointLineSeriesIndividualPointColoringPointColorColoredCartesianMVVM |
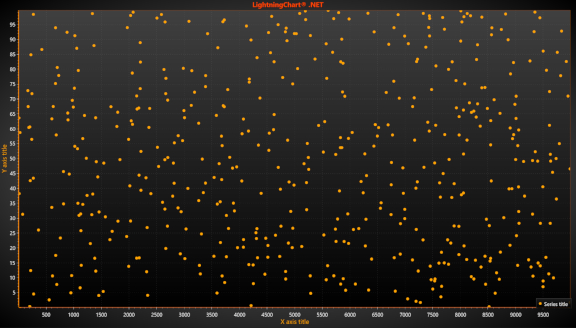 ScatterTracking ScatterTracking | Move the mouse over the chart, and annotation shows the nearest data point. | Basic2DViewXYScatterTrackingMouseFreeformPointLineSeriesAnnotationSolveNearestCartesianMVVM |
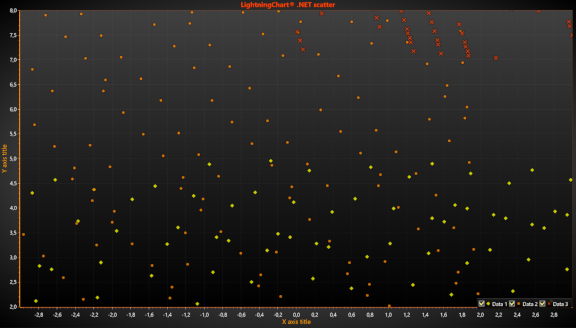 ScatterXY ScatterXY | This example shows you Scatter chart implemented with a couple of FreeformPointLine series. New point is added with timer and Point Count Limit is applied. | 2DViewXYRealtimeStreamingScatterFreeformPointLineSeriesPointCountLimitPointCartesianMVVM |
Polar, Radar & Smith Charts14 examples
| Example | Description of example | Tags |
|---|---|---|
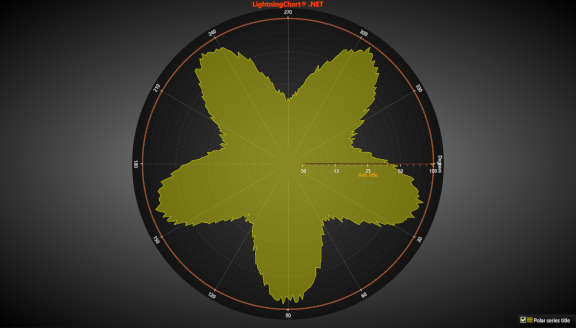 AreaSeriesPolar AreaSeriesPolar | Polar chart with area series. | PolarRealtimeStreamingAreaAreaseriesPolarBasicsMVVM |
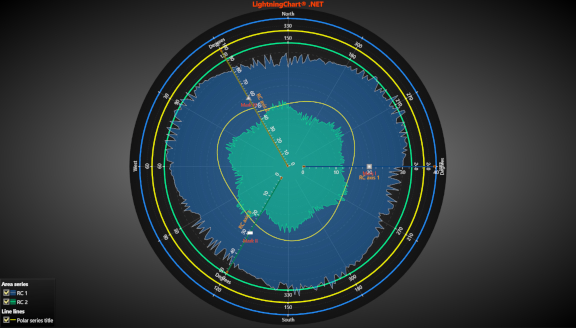 CombinedPolar CombinedPolar | Polar chart with a couple of axes. Line and area series are equipped with markers. Drag amplitude and angle axes to set new values for them. | PolarMultipleSectorMouseScatterPointsPolarEventMarkerAreaseriesPolarSupplyCustomAngleStringSupplyCustomAmplitudeStringCustomDataCursorCursorMVVM |
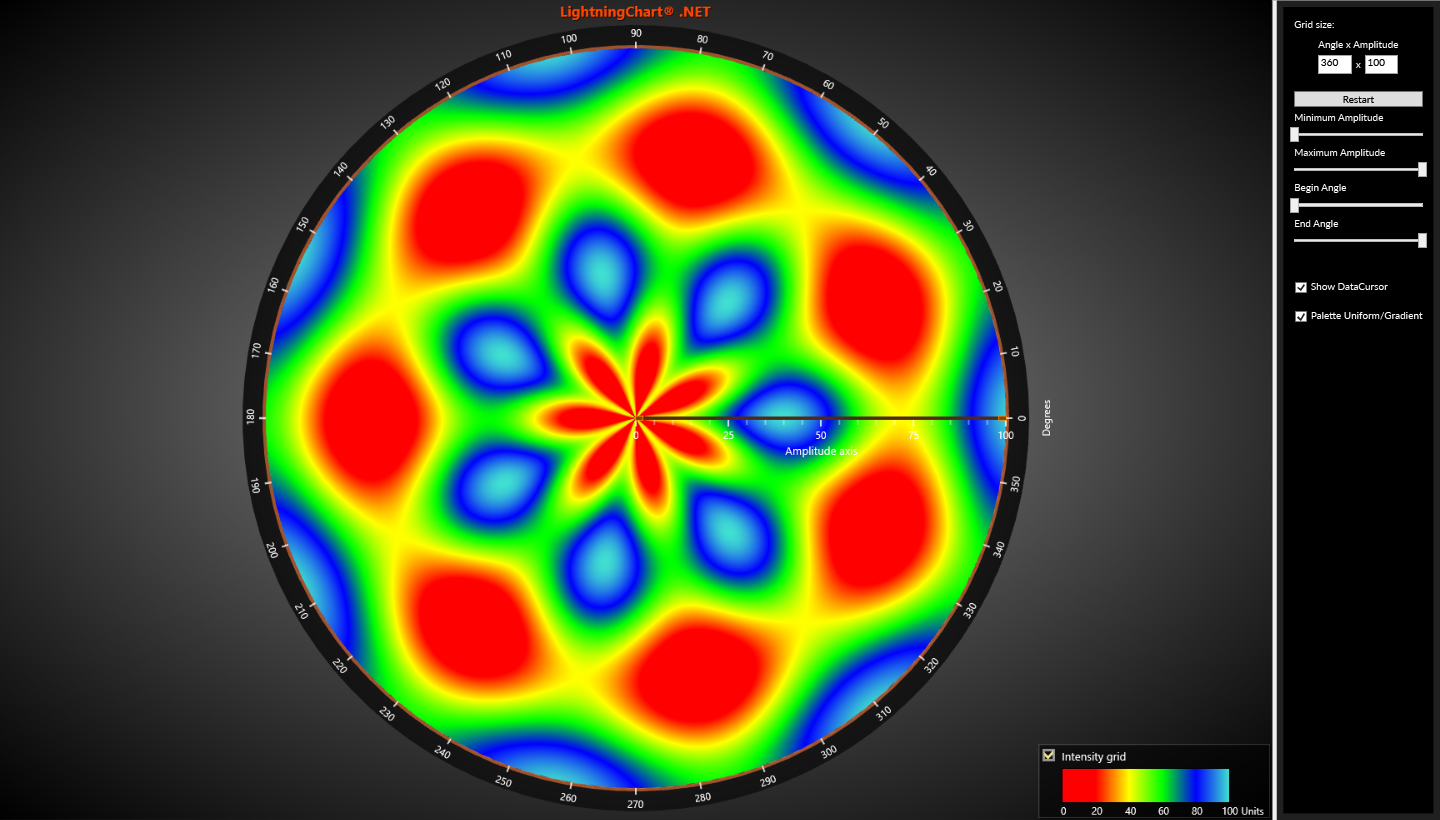 HeatMapPolar HeatMapPolar | Polar heatmap is updated in real-time. In this example IntensityGridSeriesPolar is created and updated in real-time. User can change Polar grid size and how grid is stretched. That is, grid is positioned according to MinimumAmplitude, MaximumAmplitude, BeginAngle and EndAngle settings/properties. | AnimationViewPolarPolarIntensityGridSeriesPolarIntensityGridHeatmapStreamingRealtimeThreadValueRangePalettePaletteDataCursor |
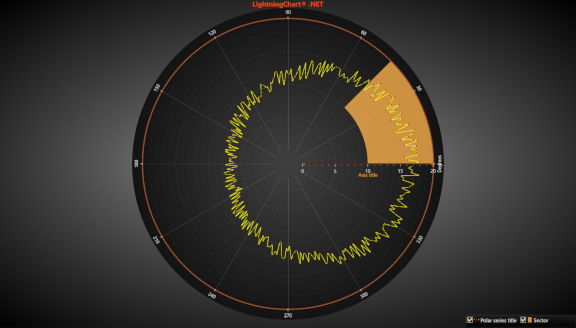 LineSeriesPolar LineSeriesPolar | Polar chart with line series and sector. | Polar2DBasicsLinePointLineSeriesPolarSectorAngleMVVM |
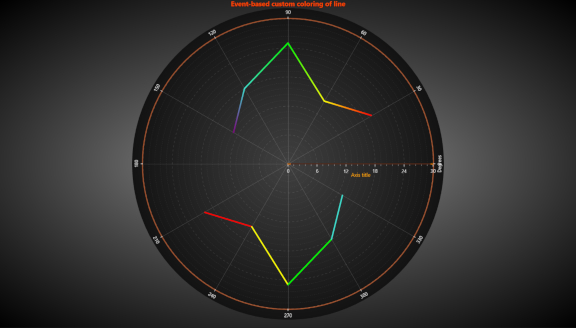 PolarLineMultiColoredByEvent PolarLineMultiColoredByEvent | Polar chart with custom coloring by event. Example shows how to use CustomLinePointColoringAndShaping event. One line colored with gradient transitions, and other with solid steps. | BasicPolarLinePointLineSeriesPolarAngleEventCustomLinePointColoringAndShapingAxisPolar2DMVVM |
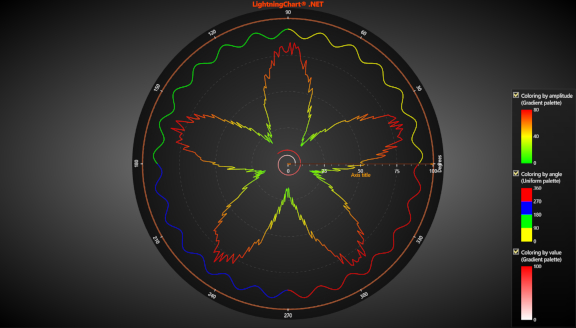 PolarLinePalette PolarLinePalette | Polar chart with palette-colored line series. Lines can be colored by amplitude, angle or Value field of each data point. ValueRangePalette converts the numeric value into color. | PolarLineAnglePaletteShowcaseDataCursorPointLineSeriesPolarPalettedByAmplitudePalettedByAnglePalettedByValueValueRangePalette2DMVVM |
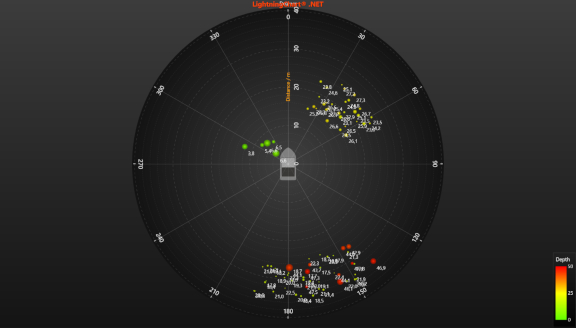 PolarPaletteColoring PolarPaletteColoring | Polar chart with palette-colored points. Illustrates a polar sonar plot, with fish indicators. Indicator is color coded by depth palette, and text label shows depth as well. | PolarPointMarkerPaletteColoringAnnotationValueRangePalettePointLineSeriesPolarBitmap2DMVVM |
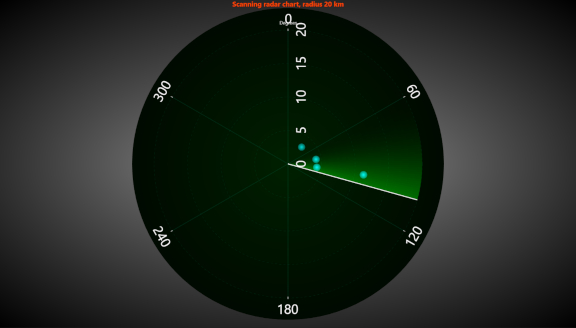 PolarRadar PolarRadar | Polar chart presenting a scanning radar. Moving objects are markers, scan effect made with sectors. | AdvancedPolarRadarAnimationMarkerSectorPointLineSeriesPolarValueToCoordScannerScanning2DMVVM |
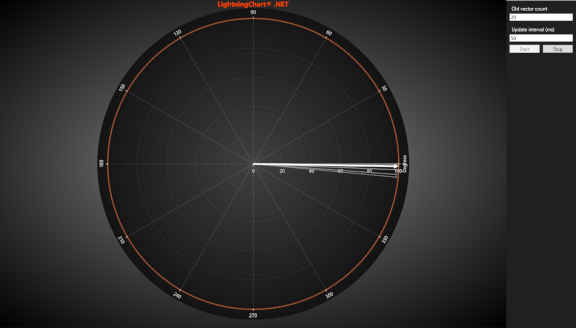 PolarVectors PolarVectors | Polar chart, annotations used as arrow vectors. Vector angle is animated, and oldest vectors are faded away. | PolarVectorArrowAnimationAnnotationDirection2DMVVM |
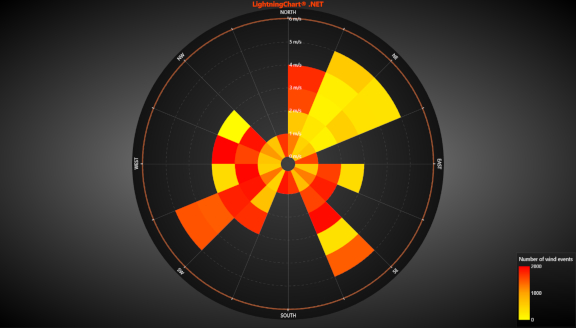 PolarWindRose PolarWindRose | Polar wind rose diagram. Sectors colored by ValueRangePalette. | PolarSectorPointLineSeriesPolarValueRangePaletteAngleDirectionWind-roseDiagramMeteorologyStatisticSupplyCustomAngleStringSupplyCustomAmplitudeString2DMVVM |
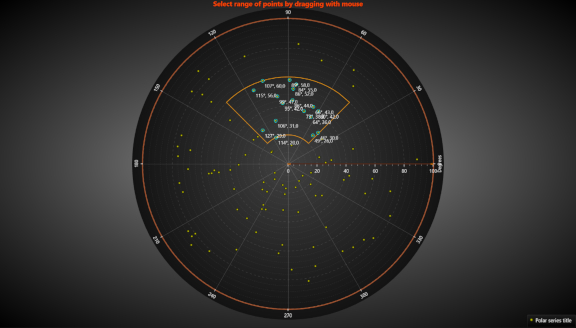 ScatterPolarMouseSelecting ScatterPolarMouseSelecting | Polar scatter chart, selecting data points by defining range by mouse. | PolarSectorPointLineSeriesPolarDataCursorMouseSelectMarkersPolarEventMarkerCoordToValue2DMVVM |
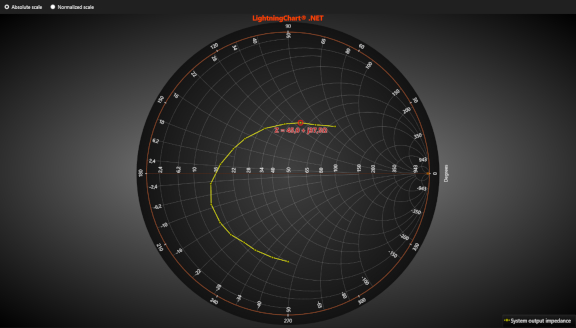 SmithLine SmithLine | Smith chart example, absolute and normalized scales, with a data cursor. | BasicSmith2DLineAngleMarkerCursorImpedanceDataCursorMVVM |
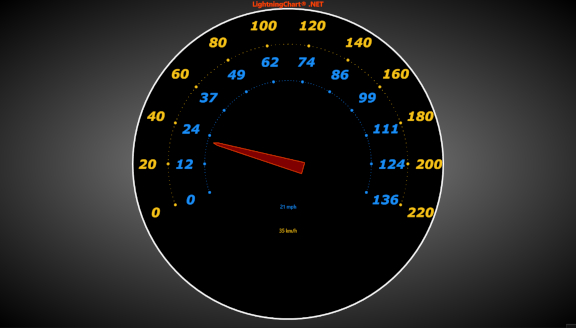 SpeedometerPolar SpeedometerPolar | Polar chart used as speedometer gauge. | AdvancedPolar2DGaugeAnimationMarkerAreaSeriesPolarPolarSeriesPointAnnotationPolarEventMarkerAngleOriginDialMVVM |
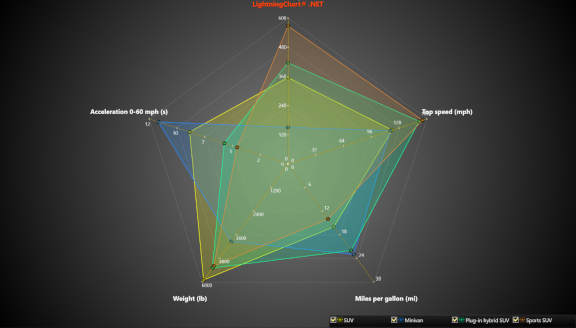 SpiderChart SpiderChart | Spider / Radar chart made with ViewPolar. | PolarAreaAreaSeriesPolarSpiderAngleUnitsRadarMVVM |
Bar Charts13 examples
| Example | Description of example | Tags |
|---|---|---|
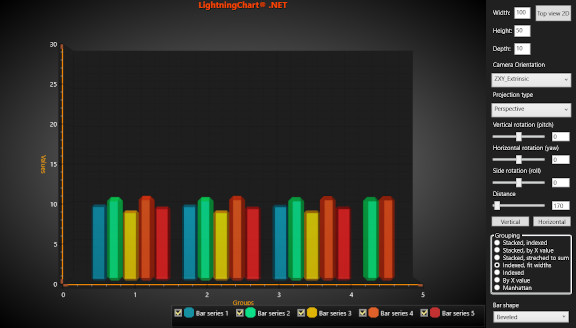 Bars3D Bars3D | Bar chart with BarSeries3D. Change different groupings and bar styles. | AdvancedView3DXYZBarsGroupingStackingStatisticDataCursorMVVM |
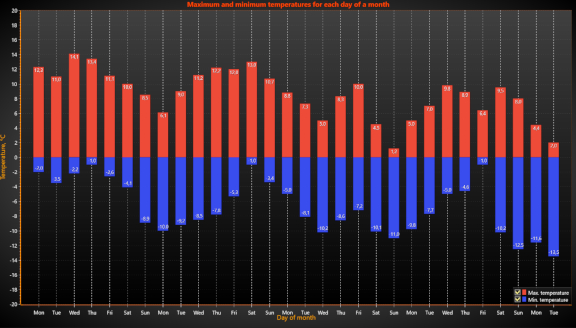 BarsNegativeValues BarsNegativeValues | In this Example Bar chart Shows maximum and minimum temperature value for each day of a month. | 2DViewXYCartesianBarsVerticalStatisticNegativeMVVM |
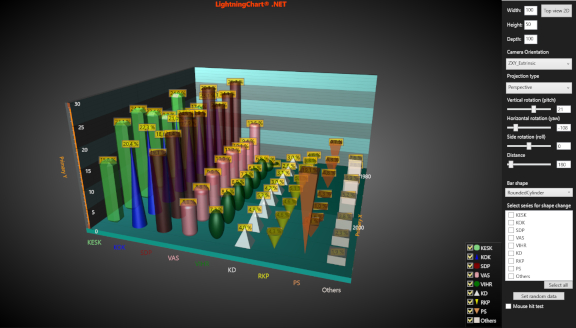 BarsParty3D BarsParty3D | Bar chart with BarSeries3D in BarViewOptions.ViewGrouping as Manhattan. Shows Finnish parlament support percentage. | AdvancedView3DXYZBarsGroupingStatisticManhattanMVVM |
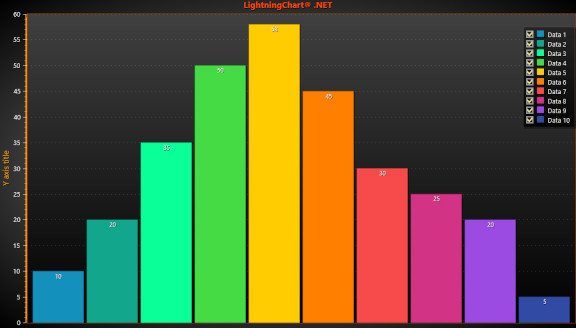 BarsSimple BarsSimple | This chart shows you simple bar chart. | 2DViewXYCartesianBarsVerticalStatisticMVVM |
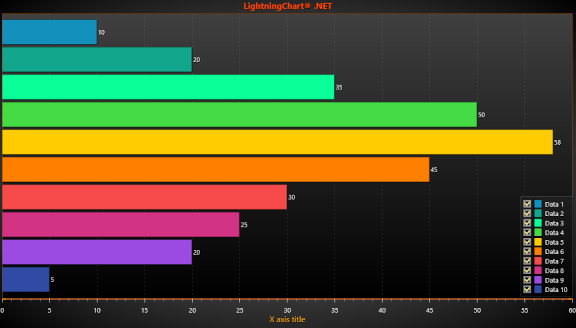 BarsSimpleHorizontal BarsSimpleHorizontal | Simple bar chart, horizontal view. | ViewXYLegendBoxMVVM2DXYCartesianStatisticBarsHorizontal |
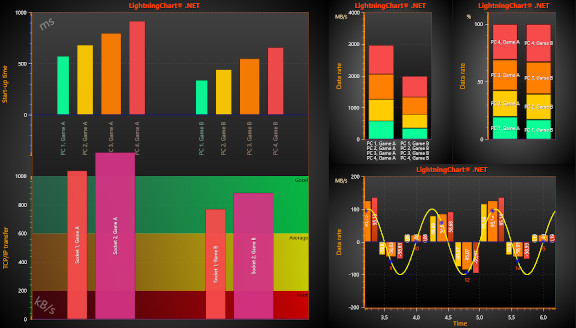 BarsXY BarsXY | Bars bound to several axes. Bands allow highlighting target area. | 2DViewXYCartesianRealtimestreamingBarsLineScrollingGeneratorMVVM |
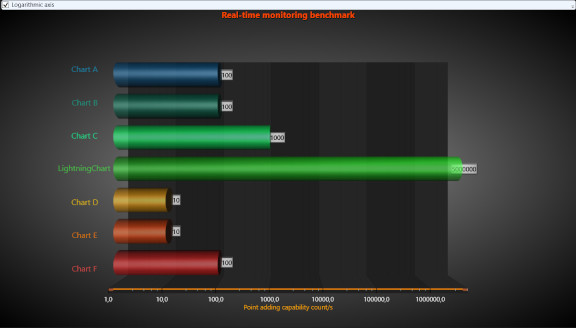 HorizontalBars3D HorizontalBars3D | The results are real benchmark results. Logarithmic axis is needed to bring the other .NET chart result bars visible. | BasicsView3DXYZBarsBarSeries3DHorizontalMVVM |
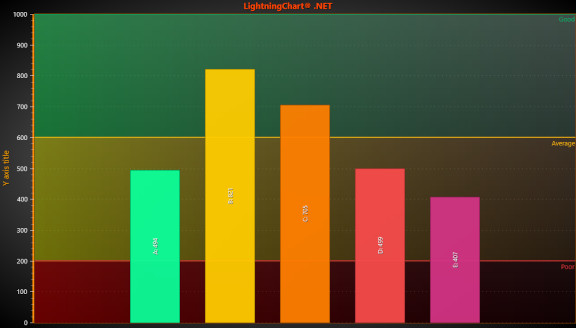 IndexedBars IndexedBars | Indexed bars example. | 2DViewXYCartesianBarsVerticalGroupingByIndexBandConstantLineMVVM |
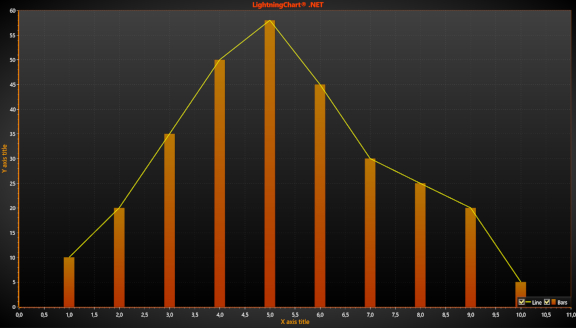 LineAndBars LineAndBars | Line and bars in same chart demonstration. | 2DBasicsViewXYCartesianLineBarsMVVM |
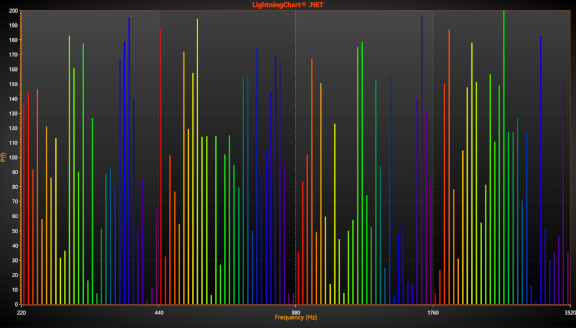 OctaveBars OctaveBars | This example shows octaves, color spectrum with bars. Using custom axis ticks and bar coloring repeating every octave. | Basic2DViewXYBarsBarSeriesCustomTicksColoringByLocationAxisGridStripsCalcGradientOctaveCartesianMVVM |
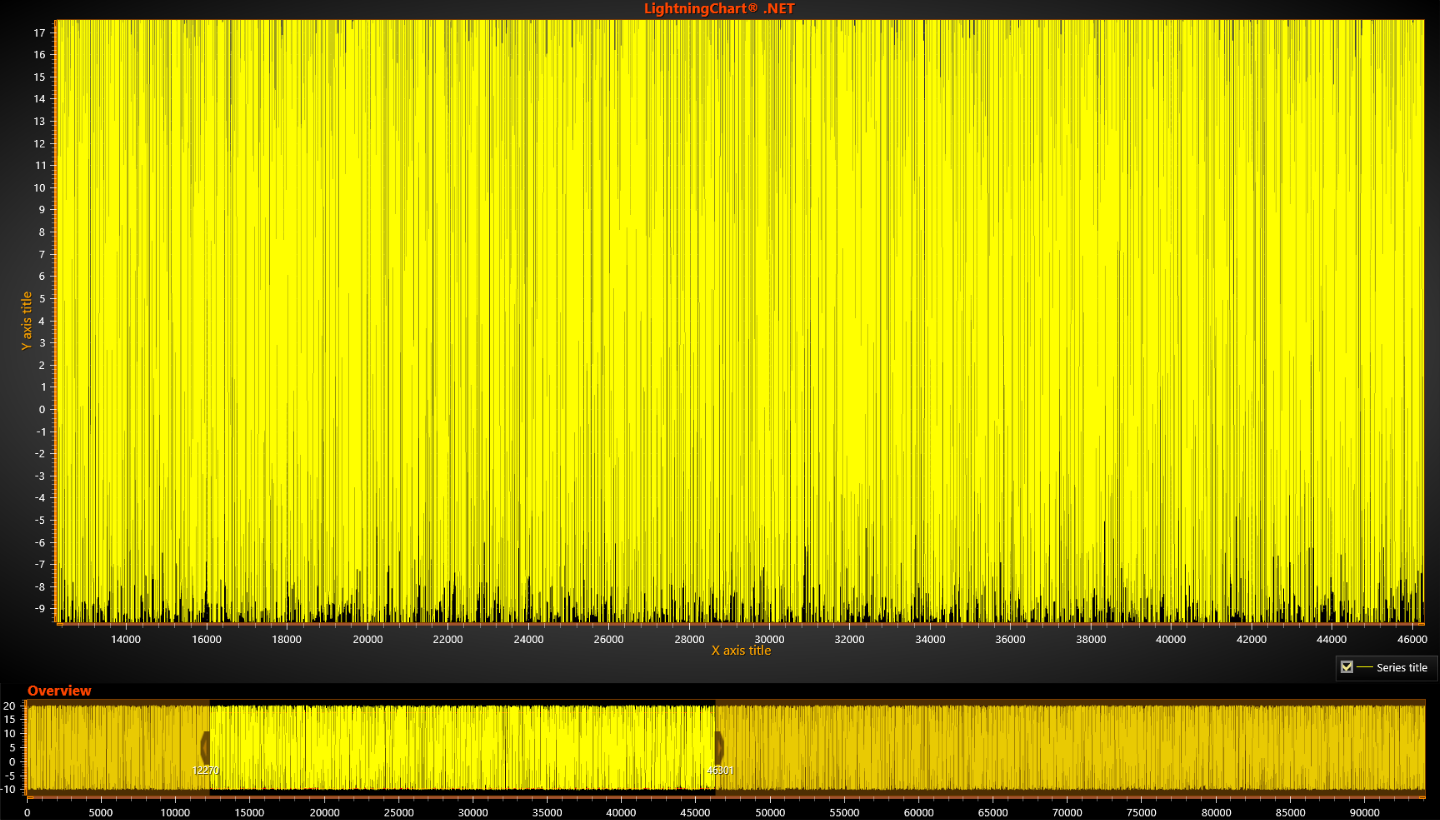 RealTimeZoomBarScrollable RealTimeZoomBarScrollable | Example shows how to create real time example with Scrollable ZoomBar. ZoomBar chart is at the bottom, while chart with zoomed part of data is above. Drag and resize vertical band in ZoomBar chart to change zooming range. Zoom range can be changed in above chart with mouse as well. | Basic2DViewXYZoomBarSampleDataBlockSeriesRealTimeStreamingScrollable |
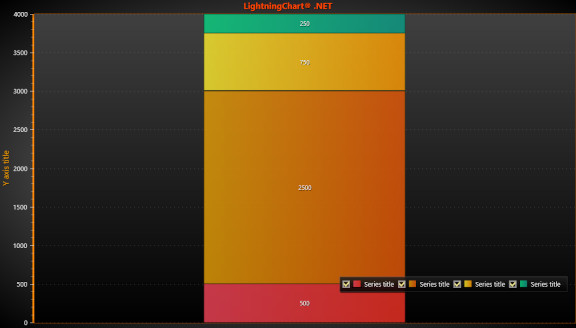 StackedBars StackedBars | This example shows you stacked bars chart. | Basic2DViewXYBarSeriesBarsGroupingByIndexFitWidthStackStackingVerticalMVVM |
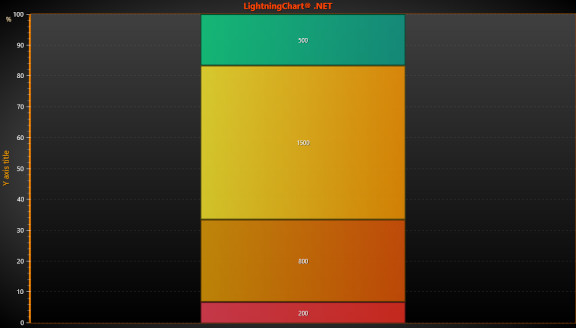 StackedBarsSum StackedBarsSum | This example shows you stretched to sum example. | Basic2DViewXYBarSeriesBarsStackingStackStretchToSumStackSumStretchedGroupingByIndexFitWidthSumUnitsVerticalMVVM |
Pie & Donut Charts5 examples
| Example | Description of example | Tags |
|---|---|---|
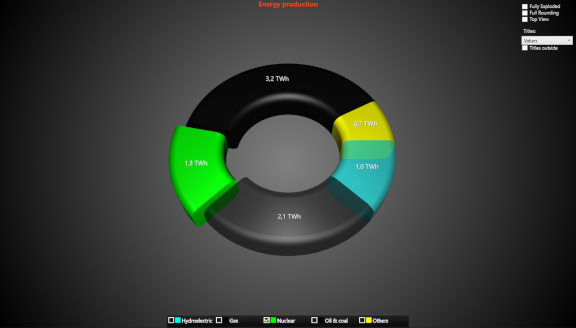 Donut Donut | Simple 3D donut/ring chart. | PieView3DDonutPieSliceExplodeTitlesStyleMVVM |
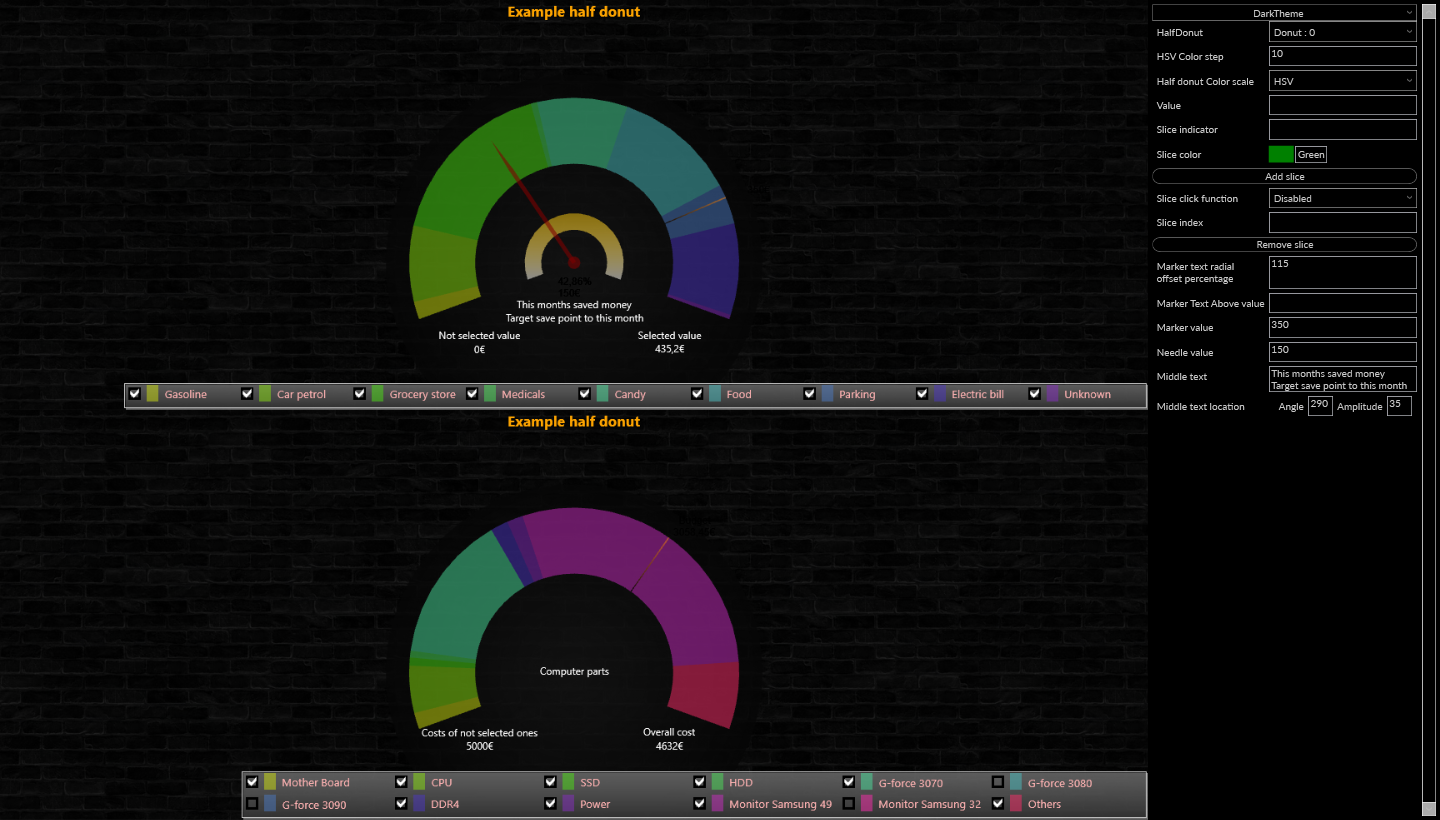 HalfDonut HalfDonut | Using HalfDonut Custom control class and shows how easy it's made half donut with this class. | PolarSegmentsHalfDonutDonutPieSliceMarker |
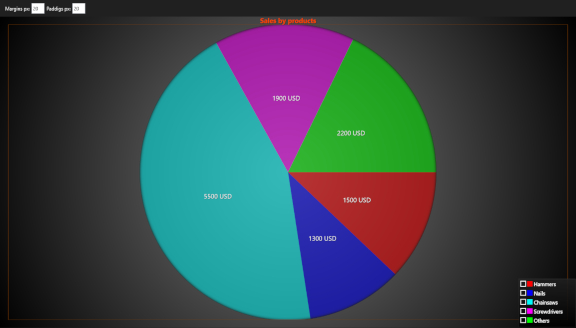 Pie2D Pie2D | It's implemented as top view from 3D pie. EFfective chart size is a product of ZoomToFit method call with given Margins and ZoomPadding property values. | BasicPie2DViewPie3DView3DOrthographicPieStyle3DPieSliceBorderZoomPaddingMarginsMVVM |
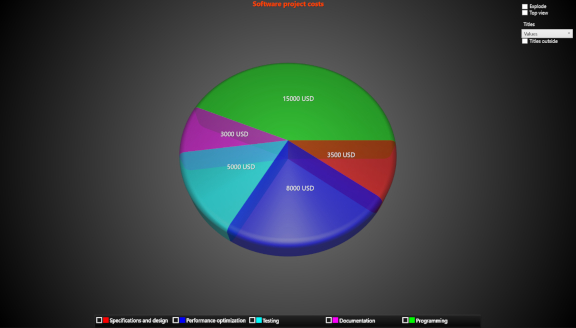 Pie3D Pie3D | Simple 3D pie chart. | BasicPieView3DViewPie3DPieStyle3DPieSlicePieTitleStyleExplodeMVVM |
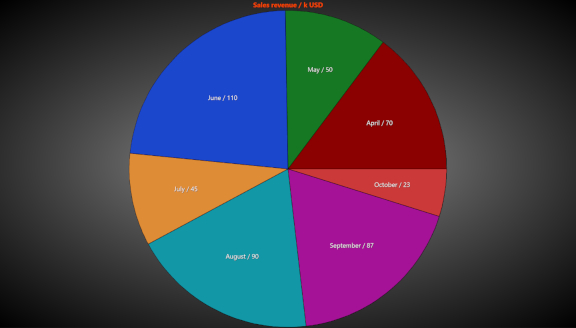 Zoomable2DPie Zoomable2DPie | Zoomable 2D pie chart, made with ViewXY and PolygonSeries. Zoom by painting a rectangle or using mouse wheel. | Pie2DZoomViewXYPolygonAspectRatioMVVM |
Volume Rendering7 examples
| Example | Description of example | Tags |
|---|---|---|
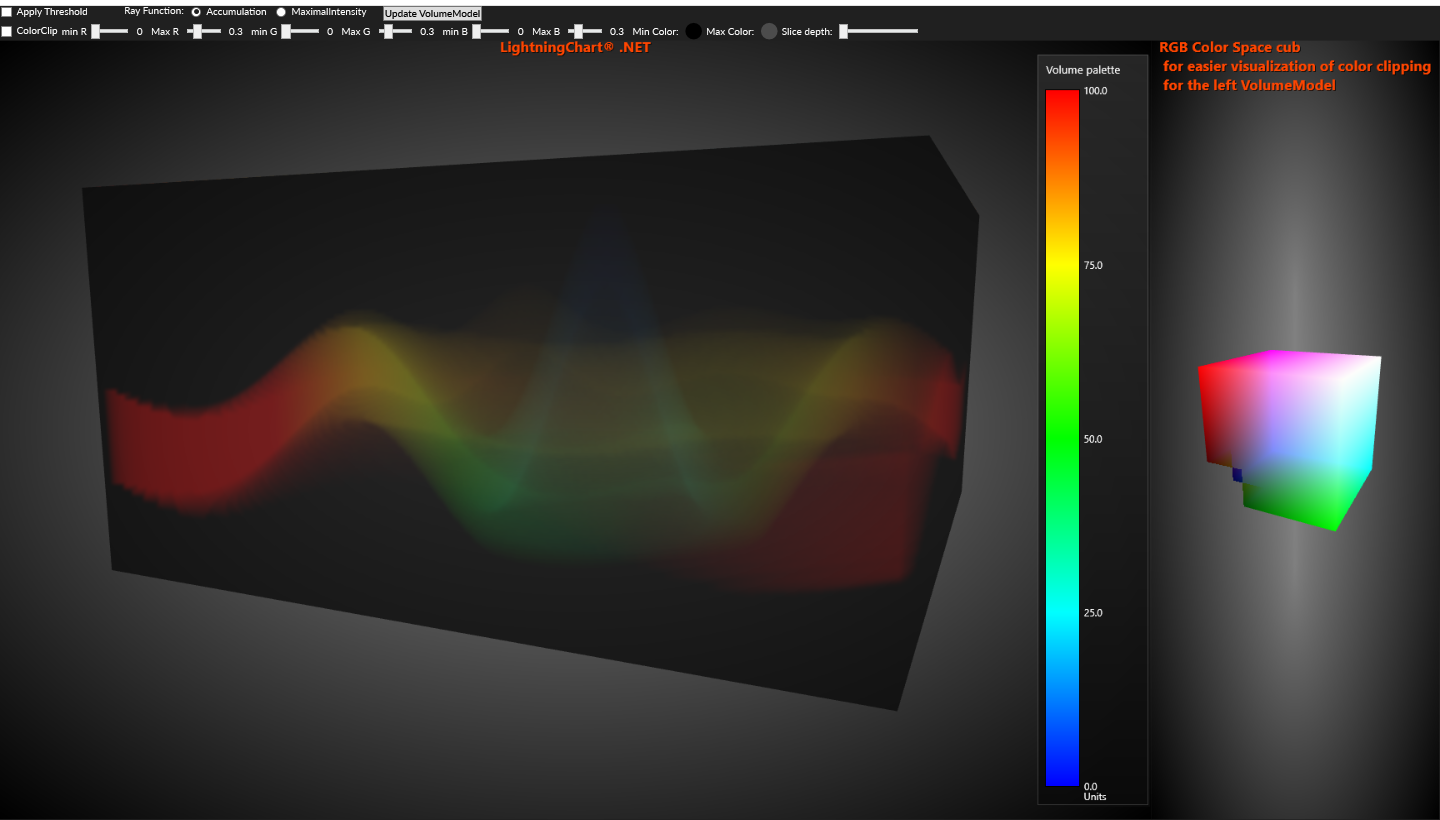 ColoringVolumeModel ColoringVolumeModel | Demonstrate how stack of 2D matrices could be converted into colored VolumeModel with LightningChart. As data set I used 3D surface, where point on surface is converted to color dot in bitmap image. The color of bitmap image is set based on given color-palette as function of distance from the center of XZ plane. LegendBox has functionality to modify volume-palette on fly. You just need to click and drag point (up or down) in LegendBox. To apply new palette for Volume model click ‘Update VolumeModel’ button. On the right RGB Color Space cube for easier visualization of color clipping, which is set for the left VolumeModel (once ClipColor is enabled) | View3DVolumeVolumeModelRayMaximalIntensityAccumulationRayFunction3DBitmapPixelClipColorRangeColorRangeToClipClipColorPaletteSlicesThresholdVolumetricVoxelMVVM |
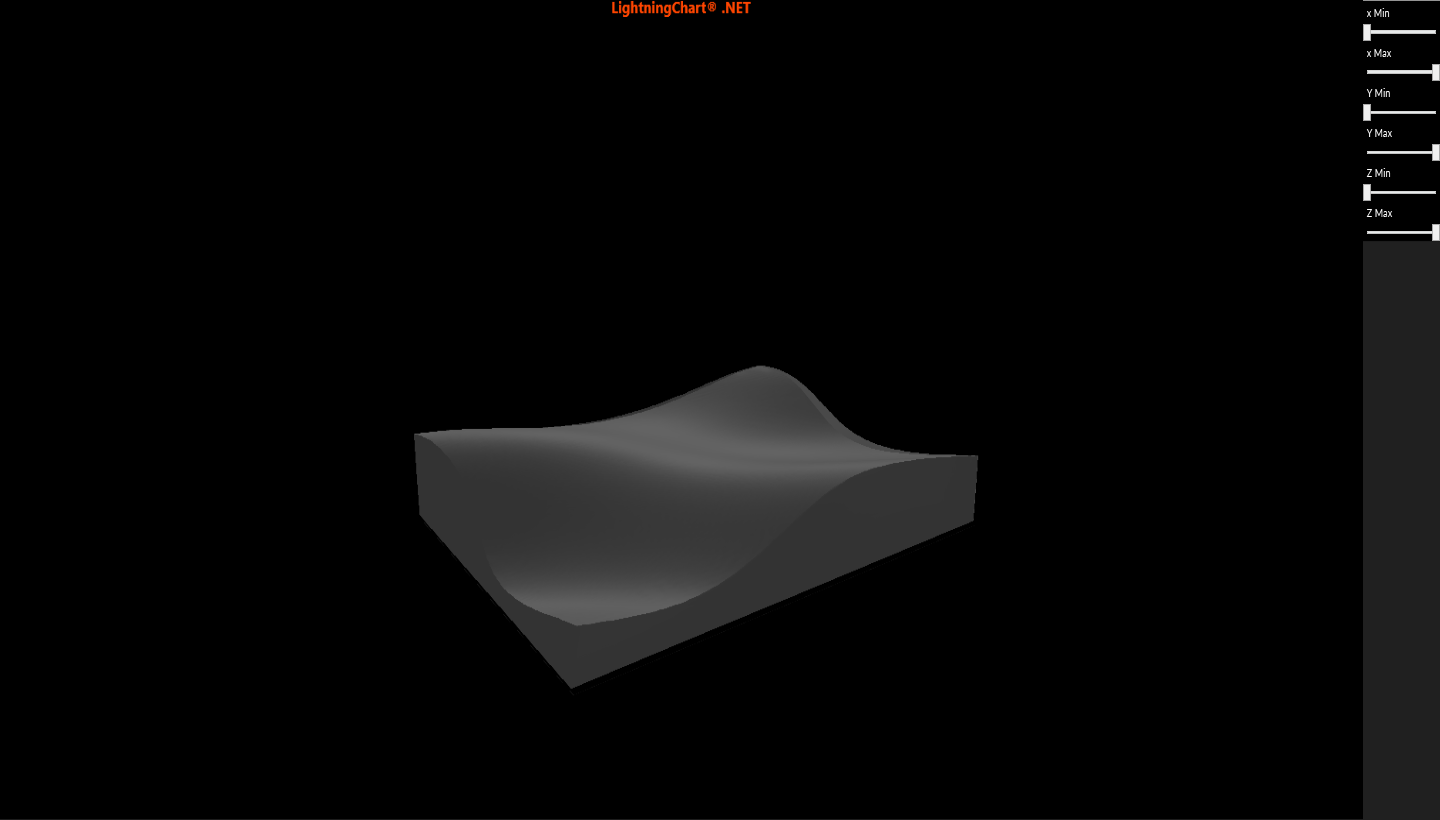 VolumeFlow VolumeFlow | Example of polygonal-modeling-like volumetric rendering. Demonstrates use case for Isosurface ray function based animations. | View3DXYZVolumeVolumeModelRaycastingRayFunctionIsosurfaceAnimationVolumetricVoxelMVVM |
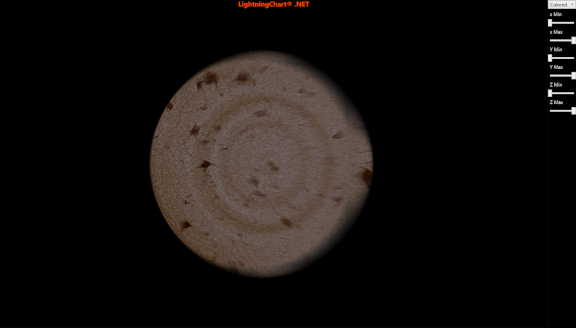 VolumeGeo VolumeGeo | Example of industrial application for volume rendering. Demonstrates use case for Accumulation ray function. Dataset is provided by Texas University. | View3DXYZVolumeVolumeModelRaycastingRayFunctionAccumulationOpacityVolumetricVoxelMVVM |
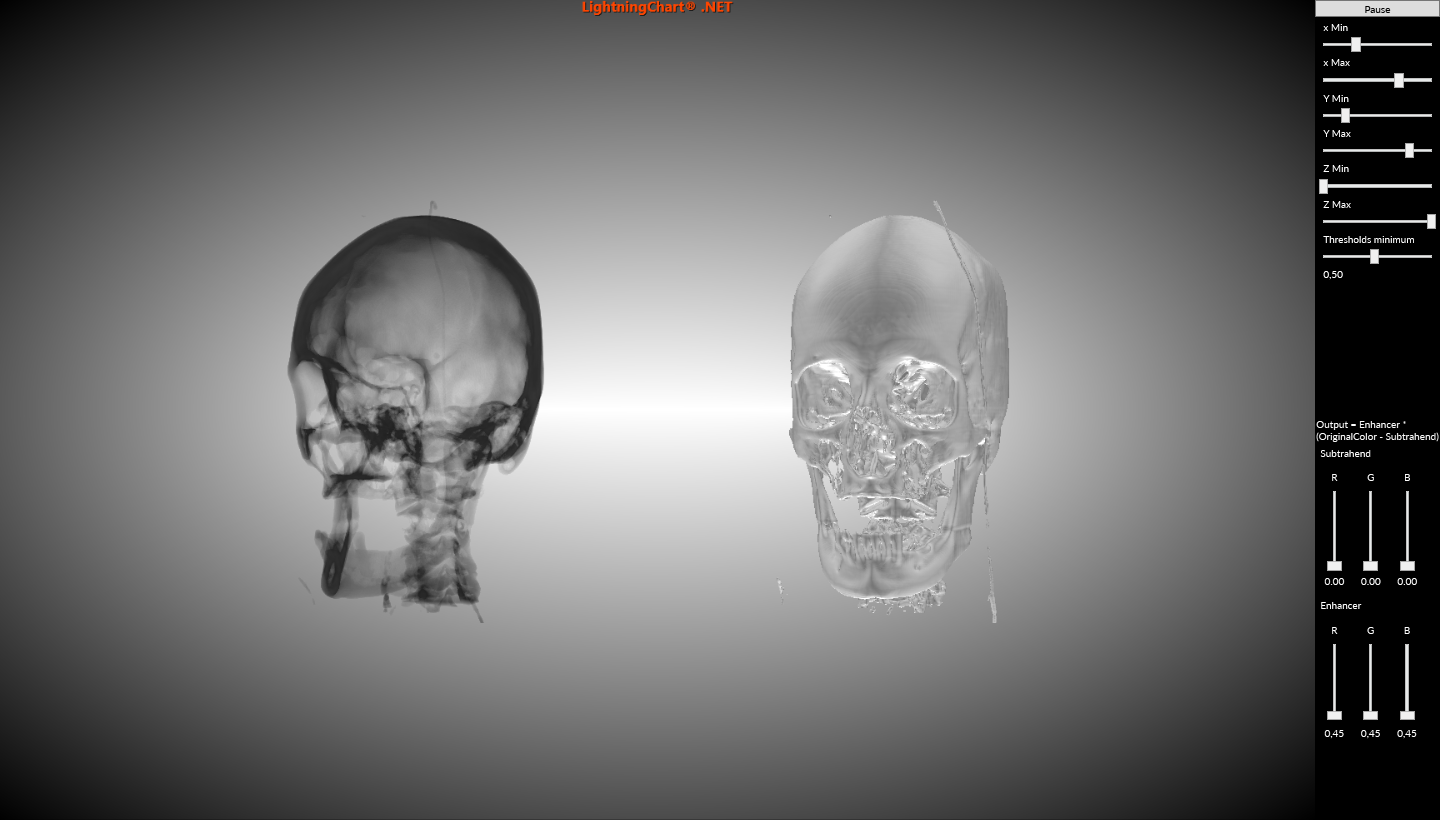 VolumeHead VolumeHead | Example of medical application for Accumulation and Isosurface ray functions. The dataset is provided by Department of Radiology at The University of Iowa. | View3DXYZVolumeVolumeModelRaycastingRayFunctionVolumetricAccumulationIsosurfaceThresholdOpacityVoxelMVVM |
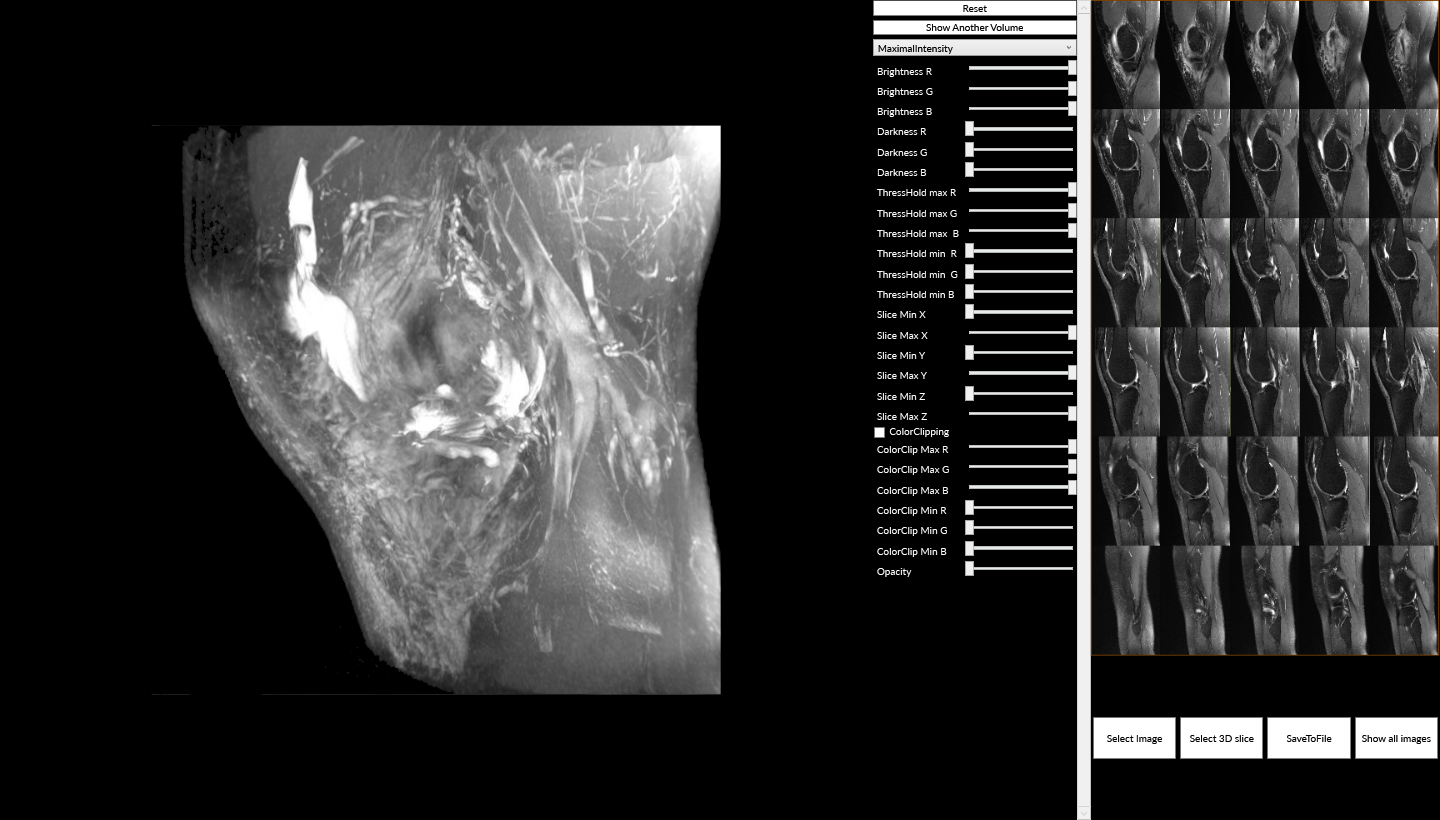 VolumeModelSlicer VolumeModelSlicer | On the left, 2 VolumeModels models are shown (while 2nd maybe hidden), which are generated from knee MRI images. 3D model rotation is done with left-mouse-button pressed. Brightness, coloring and other properties applied 1st model. It is also possible to replace 1st VolumeModel with single 3D slice-image ("Select 3D slice" button). On the right, ViewXY with individual slice-bitmaps shown. View can be zoomed onto individual image or set back to overview. Resulting 3D chart can be saved as image. | AdvancedShowcase3DViewXYVolumeModel2DSyncRayFunctionImageLayerLight3DPolygonSeriesBrightnessSliceRangeThresholdColorRangeToClipClipColorRangeXYZ |
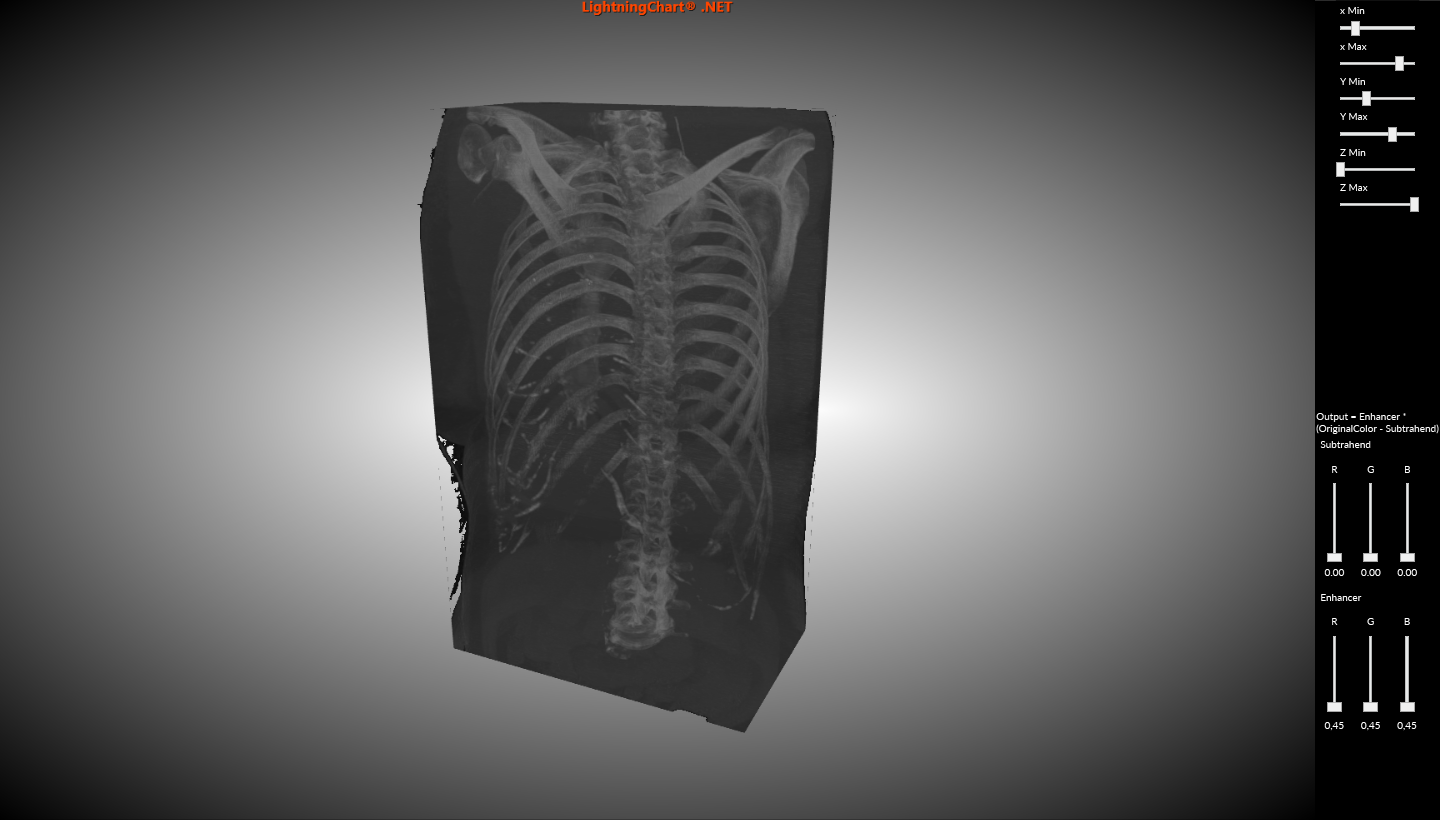 VolumeSkeleton VolumeSkeleton | Example of medical application of Maximal Intensity ray function. The dataset is provided by Department of Radiology at The University of Iowa. | View3DXYZVolumeVolumeModelRaycastingRayFunctionMaximalIntensityVolumetricVoxelMVVM |
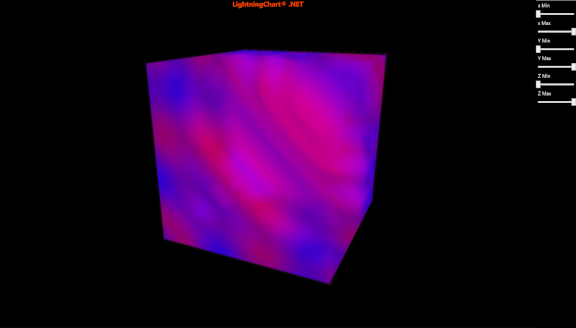 VolumeWaveInterference VolumeWaveInterference | Example real-time wave interference simulation for volume rendering. Demonstrates use case for Maximal Intensity ray function. | View3DXYZVolumeVolumeModelRayFunctionMaximalIntensityAnimationVolumetricRaycastingVoxelMVVM |
Financial & Stock Charts15 examples
| Example | Description of example | Tags |
|---|---|---|
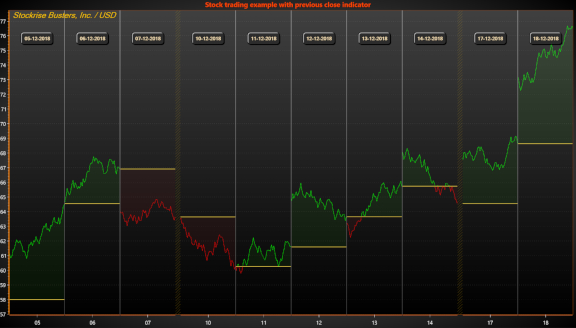 StockCourseWithPreviousClose StockCourseWithPreviousClose | The example uses HighLowSeries to show data and many FreeformPointLineSeries segments to change the line colors. | 2DViewXYHighLowSeriesAnnotationScaleBreakCustomTicksBreakTradingStockFinanceFinancialCustomAxisTickCartesianHigh-lowLineMVVM |
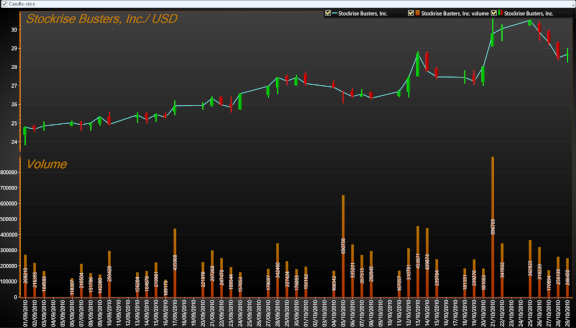 StockSeriesXY StockSeriesXY | In this Example Simple stocks series demonstration with StockSeries, PointLineSeries and BarSeries. | 2DViewXYStockSeriesBarSeriesAnnotationStackedTradingFinanceFinancialCandleCandle-stickDateTimeToAxisValueCartesianLineMVVM |
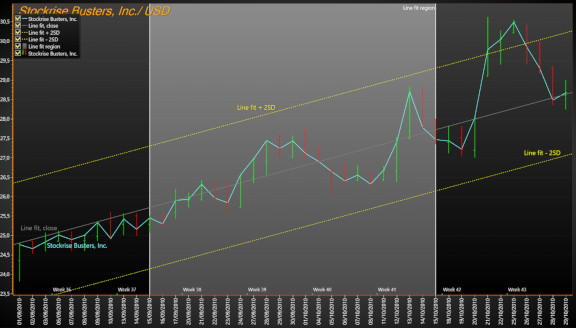 StockTradingScaleBreaks StockTradingScaleBreaks | This example shows you stock series demonstration with some statistical analytical features. Line fitting and standard deviation calculation from region of interest. Trader library is available with a custom contract, please contact Sales | 2DViewXYStockSeriesMarkerBandAnnotationCustomTickTradingFinanceFinancialBreakCartesianLine |
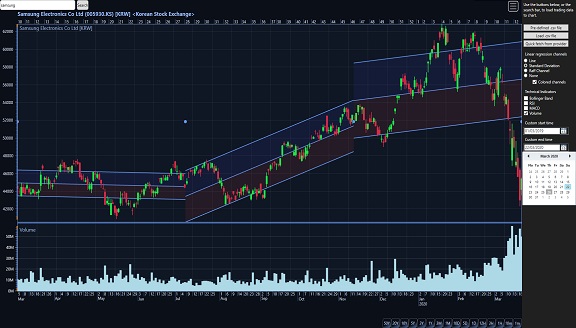 TraderAdvanced TraderAdvanced | Trading Chart example with several indicators and automatically updating Linear Regression Channel tools. Use the respective buttons and checkboxes to add and remove them. Custom time range can be set via date picker. Various datasets can be loaded from csv -files. The file should have the following values: Date, Open, Close, High, Low, Volume (optional), OpenInterest (optional). Trader library is available with a custom contract, please contact Sales | 2DViewXYTraderTradingFinanceFinancialTechnical indicatorDrawing toolData providerWebServiceInternetSecuritySymbolFileCsvLoadingStocksCandleCandle-stickOHLCFinTechTechnical analysisTechnical indicatorIndicator |
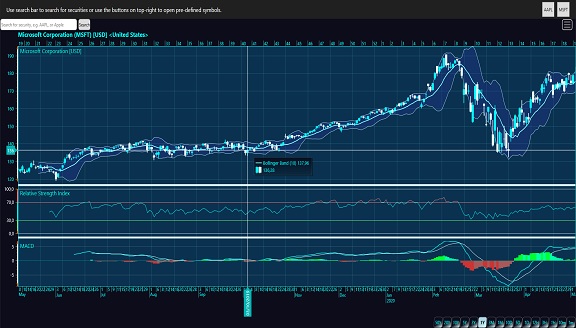 TraderDataProvider TraderDataProvider | Trading Chart example in which trading data is loaded from a pre-defined data provider (AlphaVantage.co). Internet connection is required for the example to work properly. Type the security name, company name or the symbol of the security (i.e. goog, aapl) in the search bar and press enter or the Search button. To have the example work properly, an own API key is required. Trader library is available with a custom contract, please contact Sales | 2DViewXYTraderTradingFinanceFinancialTechnical indicatorData providerWebServiceInternetSecuritySymbolLoadingStockCandleCandle-stickOHLCFinTechTechnical analysisTechnical indicatorIndicator |
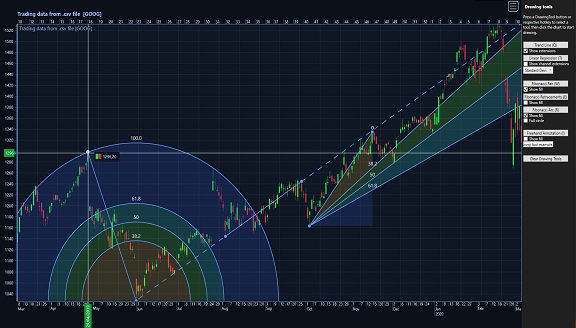 TraderDrawingToolsDrawing TraderDrawingToolsDrawing | Trading Chart demonstrating the use of drawing tools. Use given buttons or the tool menu in the top-right corner of the chart to draw various drawing tools. Checkboxes can be used to change some of their properties. Drawing tools can be modified after they are drawn by dragging their control points. Trading data itself is loaded from a .csv -file. Trader library is available with a custom contract, please contact Sales | 2DViewXYTraderTradingFinanceFinancialDrawing toolFileCsvLoadingStocksCandleCandle-stickOHLCFinTechTechnical analysisTechnical indicatorIndicator |
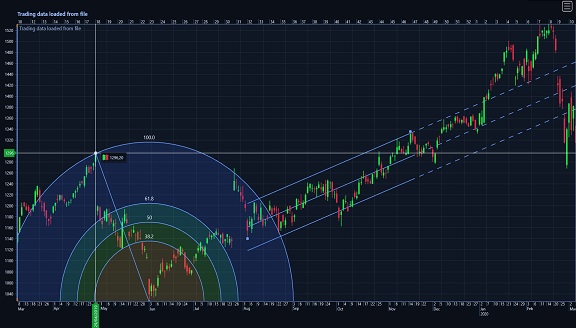 TraderDrawingToolsPreDefined TraderDrawingToolsPreDefined | Trading Chart example with pre-defined drawing tools. Linear Regression Channel and Fibonacci Arc are drawn based on the trading data. Trading data itself is loaded from a .csv -file. Trader library is available with a custom contract, please contact Sales | 2DViewXYTraderTradingFinanceFinancialDrawing toolLinear regression channelFibonacciArcFileCsvLoadingStockscandlecandle-stickOHLCFinTechTechnical analysisTechnical indicatorIndicatorFanFibonacci |
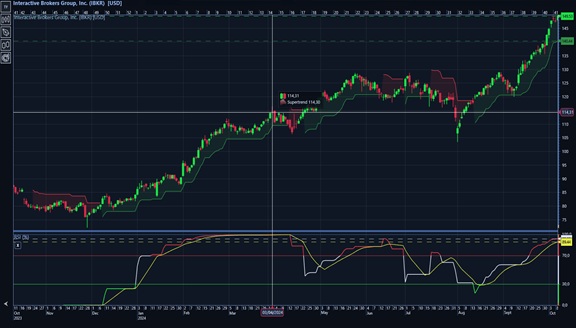 TraderNestedIndicators TraderNestedIndicators | Nested indicators feature allows technical indicators be based on each other or other OHLC fields besides Close. In the example, Relative Strength Index (RSI) is calculated based on a Supertrend indicator. Simple Moving Average is then added based on the RSI. Trader library is available with a custom contract, please contact Sales. | 2DViewXYTraderTradingFinanceFinancialTechnical indicatorConstantlineSplitterLineStocksCandleCandle-stickOHLCFinTechTechnical analysisIndicatorNewAdded |
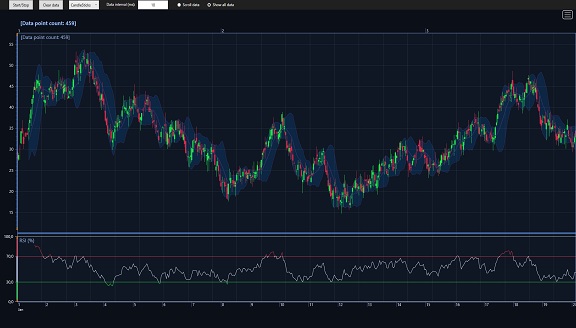 TraderPerformance TraderPerformance | Real-time example demonstrating the performance level of TradingChart component. Trading data is generated in a separate DataGenerator class to simulate an external data provider. Trader library is available with a custom contract, please contact Sales | 2DViewXYTraderTradingFinanceFinancialRealtimeStreamingStocksAreaMountainOHLCFinTechTechnical analysisTechnical indicatorIndicator |
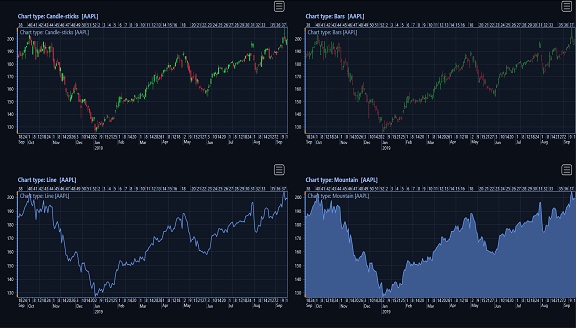 TraderPriceChartTypes TraderPriceChartTypes | Trader example showing four Trading Charts, each one set to use the same data set but different price chart types. Available types are CandleSticks, Bars, Line and Mountain. Trader library is available with a custom contract, please contact Sales | 2DViewXYTraderTradingFinanceFinancialStockCandleCandle-stickLineMountainBarsAreaOHLCFinTechTechnical analysisTechnical indicatorIndicator |
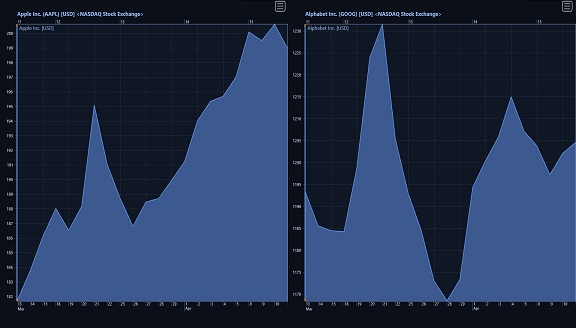 TraderRealTime TraderRealTime | Two Trading Charts placed side by side, showing data from two different securities. The data sets are updated every 10 seconds. This example uses built-in AlphaVantage data provider (premium version). To have it work properly, an own API key is required. Trader library is available with a custom contract, please contact Sales | 2DViewXYTraderTradingFinanceFinancialRealtimeStreamingStocksAreaMountainOHLCFinTechTechnical analysisTechnical indicatorIndicator |
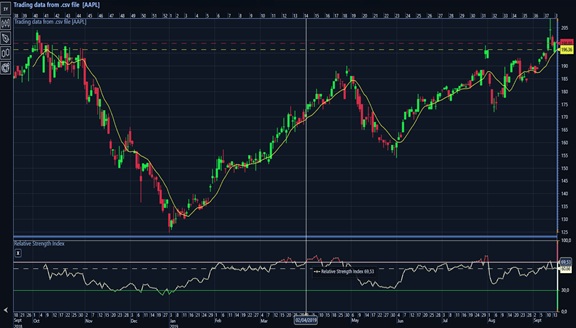 TraderSimple TraderSimple | Trader example in which trading data is loaded from a .csv -file. Relative Strength Index and Simple Moving Average indicators based on the data are added to the chart. Trader library is available with a custom contract, please contact Sales | 2DViewXYTraderTradingFinanceFinancialTechnical indicatorFileCsvLoadingStockCandleCandle-stickOHLCFinTechTechnical analysisTechnical indicatorIndicator |
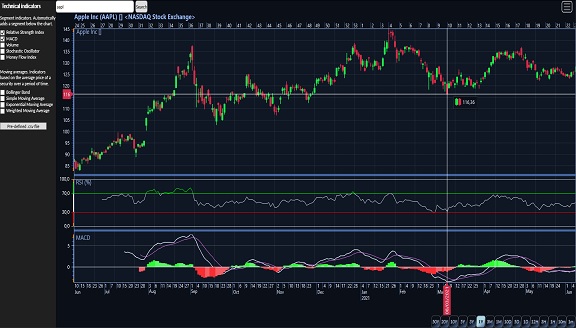 TraderTechnicalIndicators TraderTechnicalIndicators | Indicators can also be added via the indicator menu in the top-right corner of the chart. Trader library is available with a custom contract, please contact Sales | 2DViewXYTraderTradingFinanceFinancialTechnical indicatorConstantlineSplitterLineStocksCandleCandle-stickOHLCFinTechTechnical analysisTechnical indicatorIndicator |
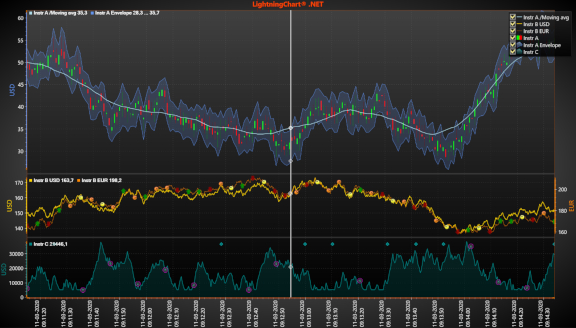 TradingMultiSegment TradingMultiSegment | Trading example in multi-segment view, with various series types and markers. Grab at the horizontal line between segment to resize the segments. Trader library is available with a custom contract, please contact Sales. | ShowcaseAdvanced2DViewXYSegmentedSplitterMarkerYAxisSegmentConstantLineHighLowSeriesAreaSeriesLineSeriesCursorLineStockTrackingResizeTradingFinanceFinancialCandleCandle-stickBarsCartesian |
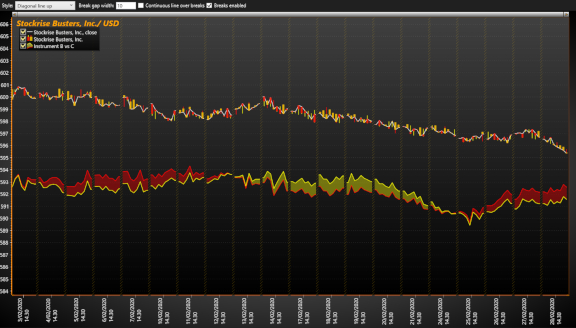 TradingScaleBreaks TradingScaleBreaks | This example shows you financial data example. Trader library is available with a custom contract, please contact Sales | 2DViewXYScaleBreakHighLowSeriesScrollbarStockTradingCandleCandle-stickBarsAnnotationBreakFinanceFinancialCartesian |
Statistical & Specialized Charts10 examples
| Example | Description of example | Tags |
|---|---|---|
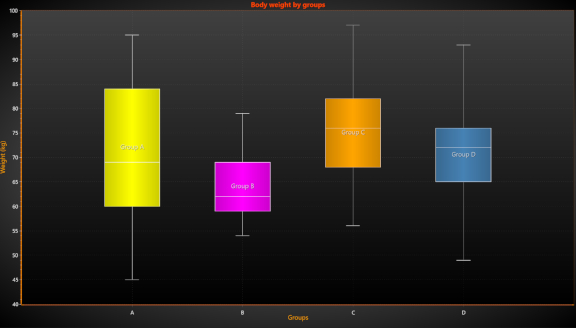 BoxWhiskerPlot BoxWhiskerPlot | This example shows you box/whisker plot. | 2DViewXYCartesianWhiskerTailBoxRectanglePolygonLinecollectionToleranceErrorStatisticMVVM |
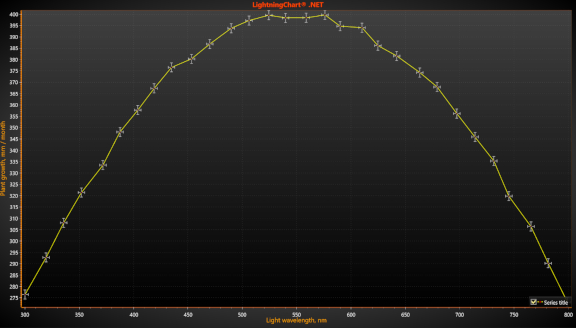 ErrorBars ErrorBars | In this exaple FreeFormPointLineSeries with error bars, to show the maximum measurement error for each point. | 2DBasicsViewXYCartesianPointlineLineErrorbarToleranceMVVM |
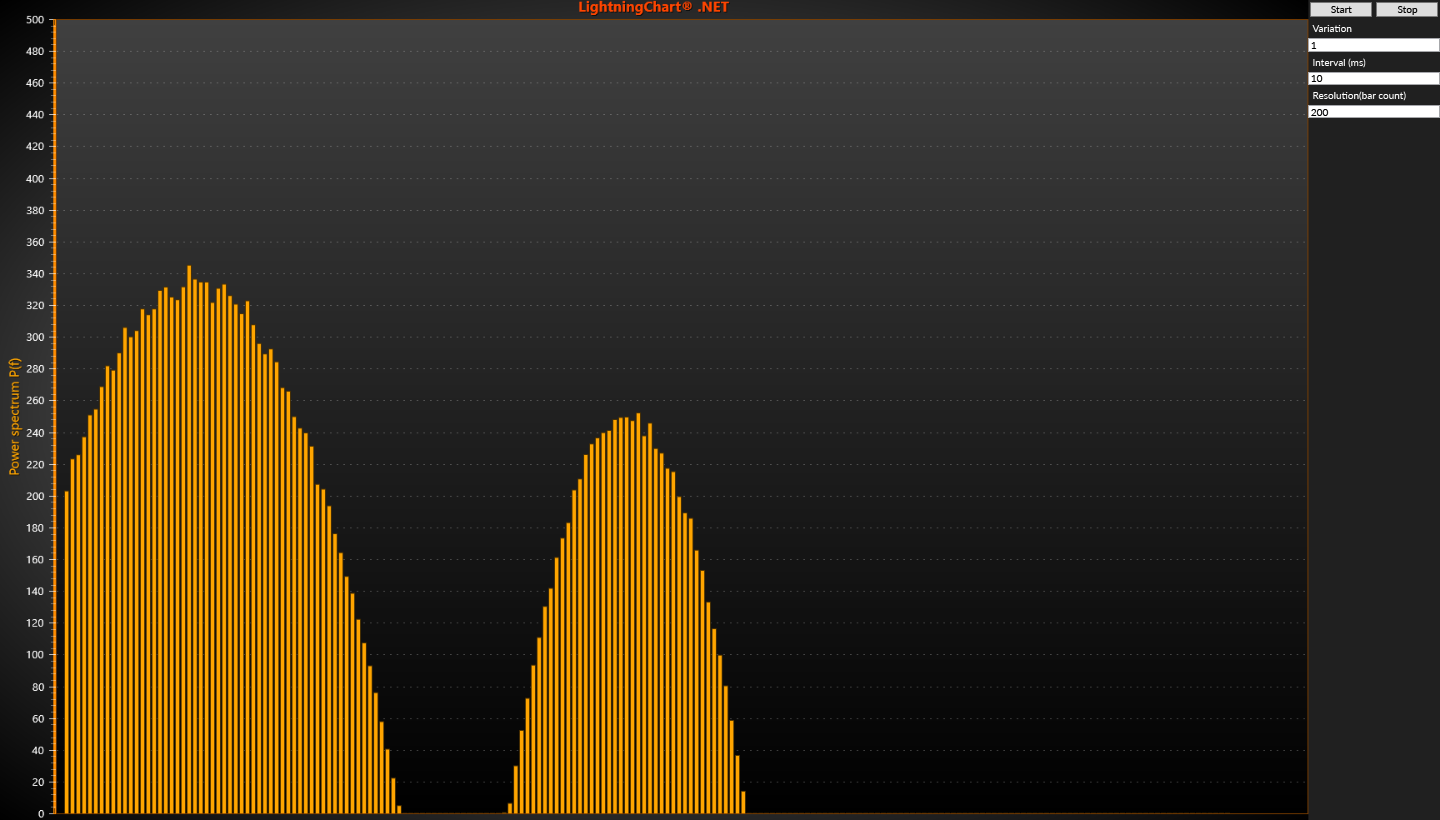 HistogramXY HistogramXY | Bar series used as histogram. | 2DViewXYCartesianRealtimestreamingSpectrumHistogramBarsTimer |
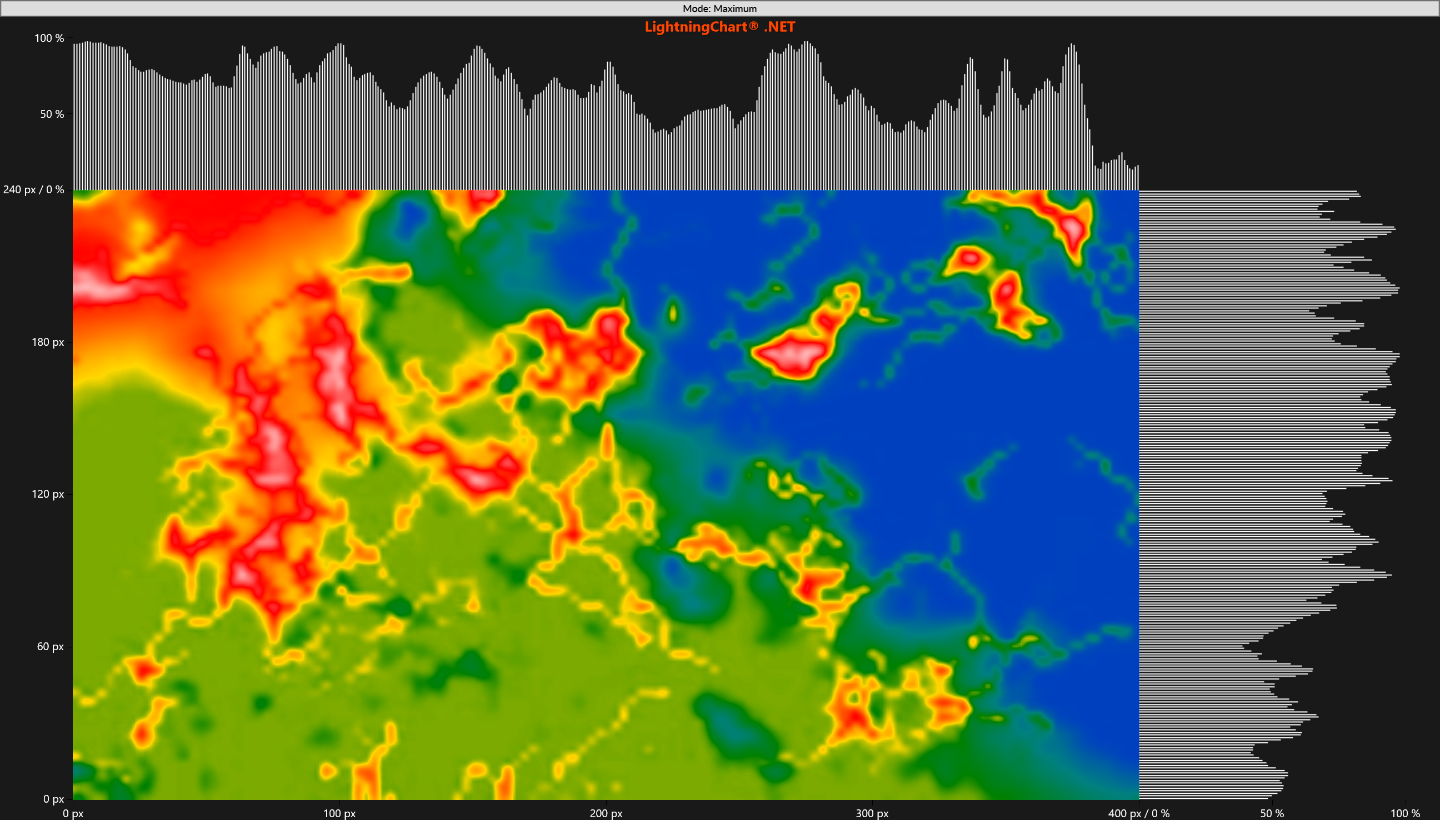 MarginalDensityPlot MarginalDensityPlot | This example displays a heat map and marginal plots calculated from its IntensityGridSeries data. The heat map axes show bitmap coordinates in pixels, while the marginal axes show normalized projection values in percent. Use the calculation mode button to switch between average, maximum, and minimum projections. | 2DViewXYHeatmapIntensityMarginalDensityIntensityGridSeriesLineCollectionAutoPaddingCustomTicksCartesianNewAdded |
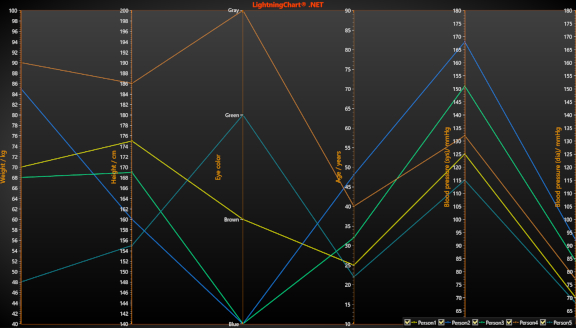 ParallelCoordinates ParallelCoordinates | Parallel coordinates chart example showing multivariate subject data. The given attribute is scaled to master axis scale. | 2DViewXYParallelCoordinatesCategoriesLineDataCursorCustomTicksYAxisAutoPlacementValueToCoordCoordToValueCartesianMVVM |
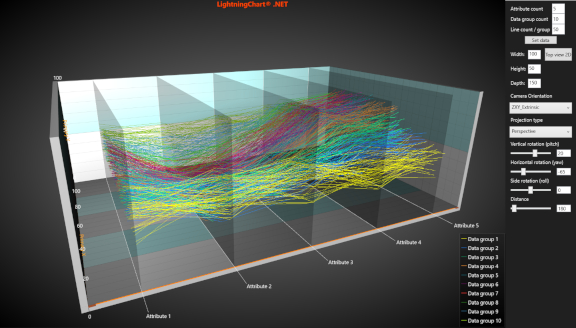 ParallelCoordinates3D ParallelCoordinates3D | 3D parallel coordinates chart, which visualize high dimensional (multivariate) data. Group (along x-axis) and attribute (along z-axis) count can be modified. | View3DXYZLineRectangle3DPlaneParallelCoordinatePointLineSeries3DMVVM |
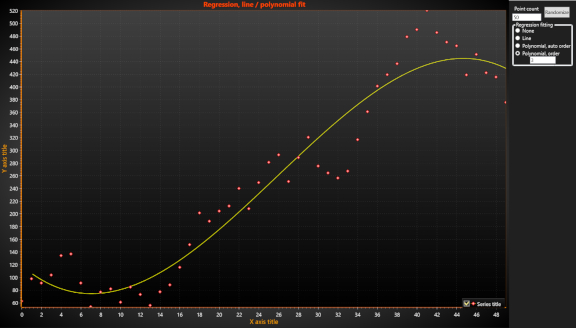 Regression Regression | Regression fitting, utilizing RegressionFitting and RegressionPolyOrder properties of PointLineSeries. When RegressionFitting is set other than None option, line and points are replaced with fitted curve. | Basic2DViewXYLinePointLineSeriesFittingPolynomialRegressionLinearCartesianMVVM |
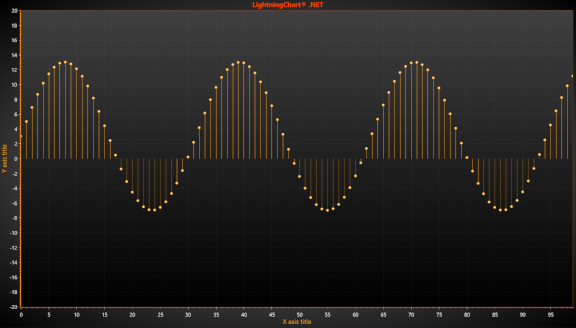 StemPlot StemPlot | This example shows stem plot made with PointLineSeries and LineCollection. | Basic2DViewXYStemLineCollectionPointLineSeriesPointsLineCartesianLineMVVM |
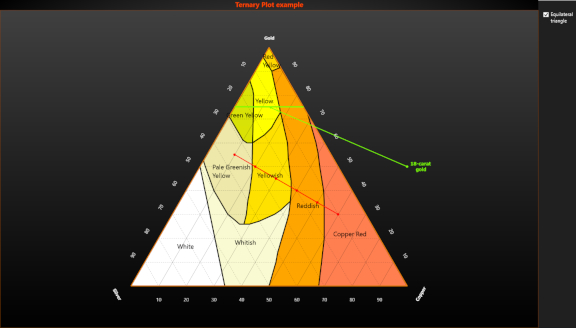 TernaryPlot TernaryPlot | Ternary Plot demo. The Ternary point value are shown when mouse Cursor is inside of triangle.Made with ViewXY's objects. | Advanced2DViewXYTernaryBarycentricTriangleAnnotationPolygonLineCollectionMVVM |
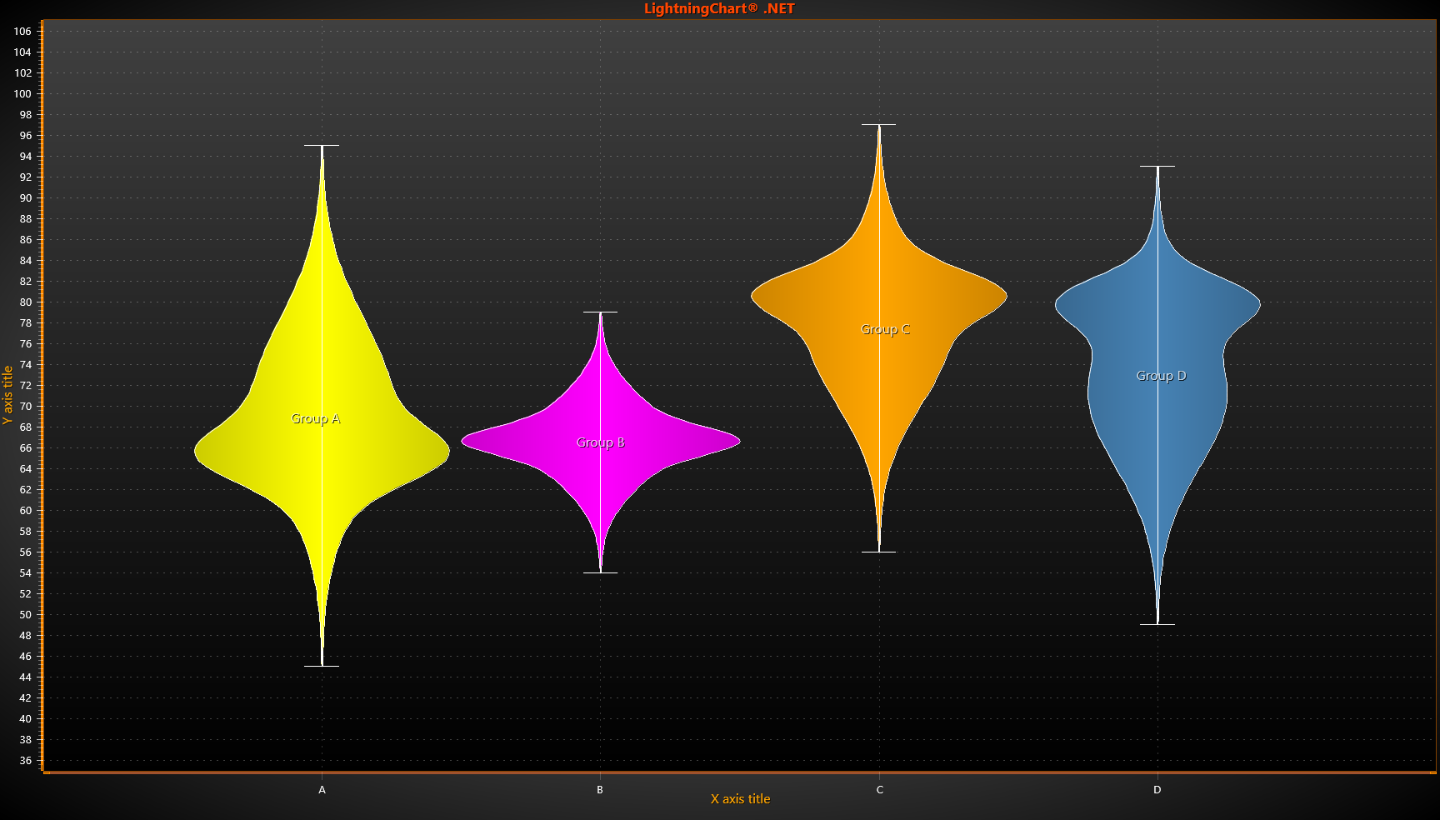 ViolinPlot ViolinPlot | A violin plot depicts distributions of numeric data for one or more groups using density curves. | ViolinKDEKernelDensityEstimateCurveGaussianPolygonLineCollectionViewXYXYBasic |
Chart Interaction & Utilities38 examples
| Example | Description of example | Tags |
|---|---|---|
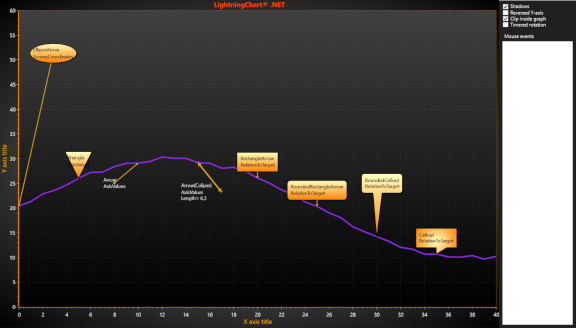 AnnotationsXY AnnotationsXY | ViewXY annotations example. Annotations can be used in various shapes and styles, and they are mouse-interactive. Click on the annotation to bring the edit controls visible. Press Shift key to use alternative/aligned operation. Right-click on the annotation to open a context menu. | 2DViewXYCartesianAnnotationIndicatorLabelDataCursorMouseEventsMVVM |
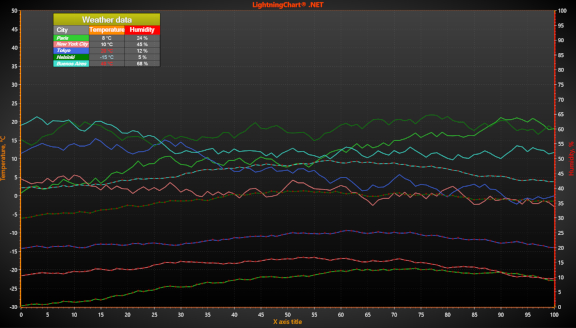 AnnotationTable AnnotationTable | This example shows you result table made with Annotations. | 2DViewXYCartesianAnnotationStatisticTableDataCursorLineAnnotationTableMVVM |
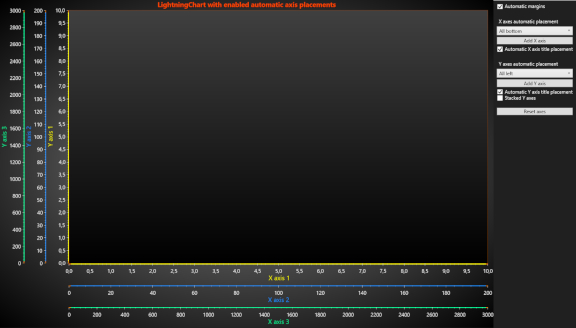 AutoAxisPlacements AutoAxisPlacements | Automatic axis placements example. LightningChart comes with automatic axis placement options as well as possiblity to set the placement explicitly. | 2DBasicsViewXYCartesianAxesAutoPlacementMarginsMVVM |
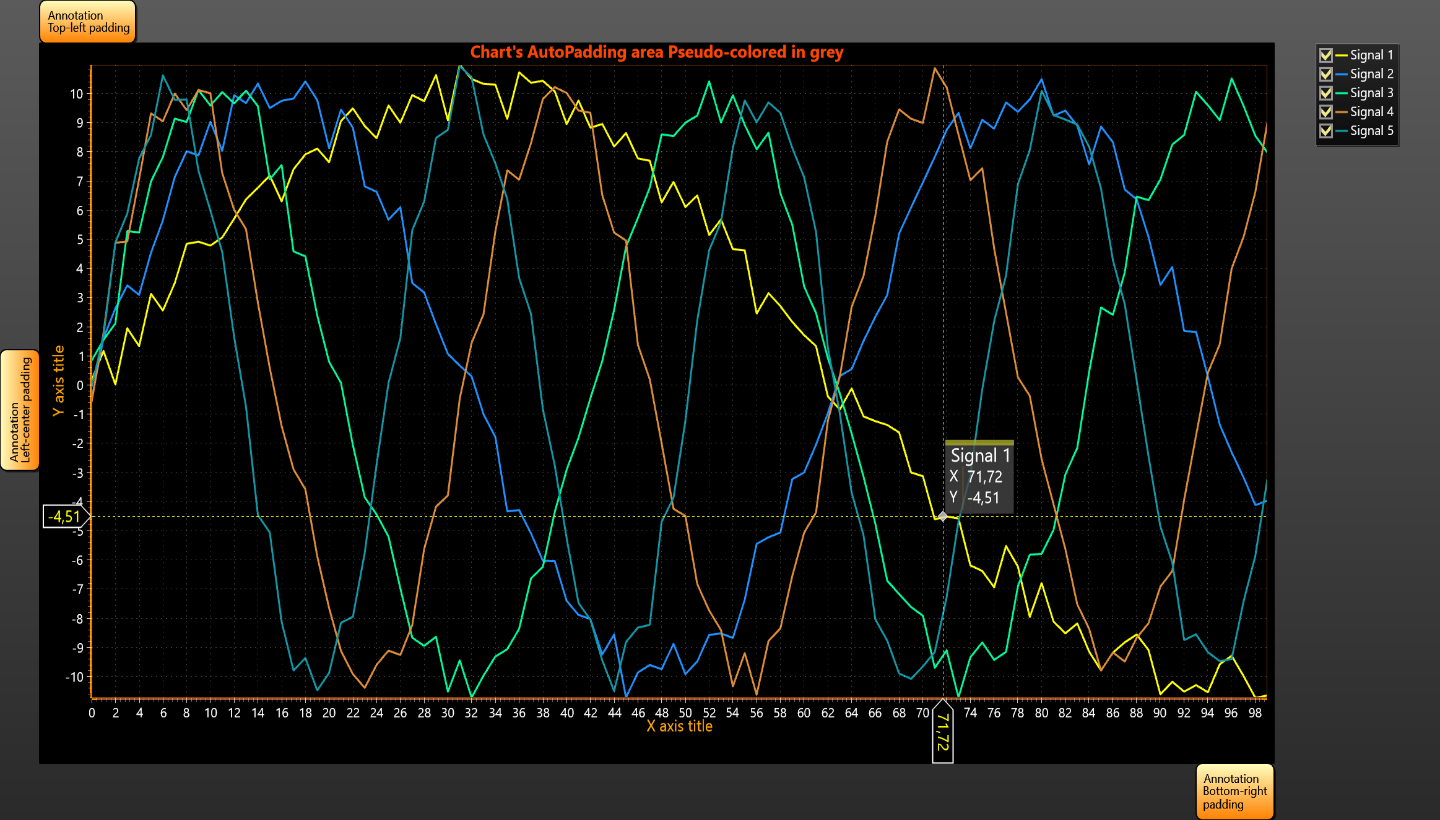 AutoPadding AutoPadding | ViewXY has AutoPadding property. This is padding for control's edges in PXs. This is outer edge or rim of the chart, which encloses ViewXY margins. Will be used when Margins are auto-adjusted (AxisLayout.AutoAdjustMargins is enabled). Chart object like Annotation or LegendBox can be placed in that padded area. Padded area is pseudo-colored differently for clarity (with Annotation help). | ViewXYLineAutoPaddingLiteLineSeriesDataCursorAnnotationXYViewXYGridVisibilityOrderBackgroundLegendBoxNewAdded |
 AxisLabelRangeEdit AxisLabelRangeEdit | Axis range editing by clicking on the labels. Click on any numberic label, to adjust minimum or maximum. | 2DViewXYCartesianLineRangeLabelsMVVM |
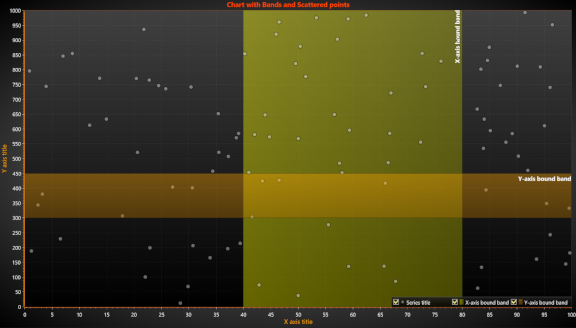 Bands Bands | Simple bands example with FreeformPointLineSeries. | 2DBasicsViewXYCartesianBandRegionAoiHighlightRangeDataCursorMVVM |
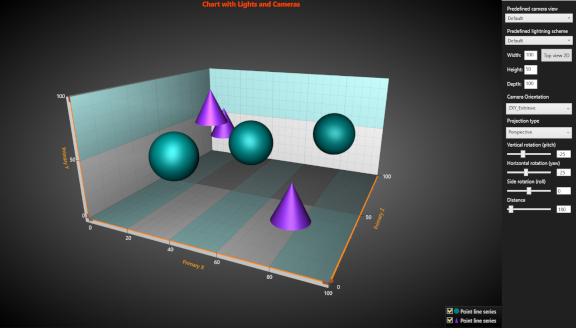 CamerasAndLights CamerasAndLights | Predefined camera views and lighting schemes demo. Chart contents are made with PointLineSeries3D. | BasicsView3DXYZCameraLightThemeMaterialsMVVM |
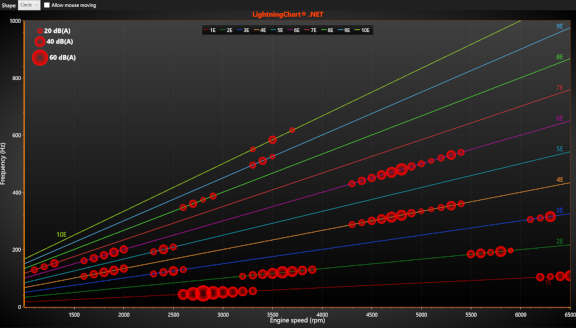 CampbellDiagramXY CampbellDiagramXY | This example shows you campbell diagram composed from PointLine series and markers | 2DViewXYCartesianCampbellNoiseEngineVibrationLineMarkerMVVM |
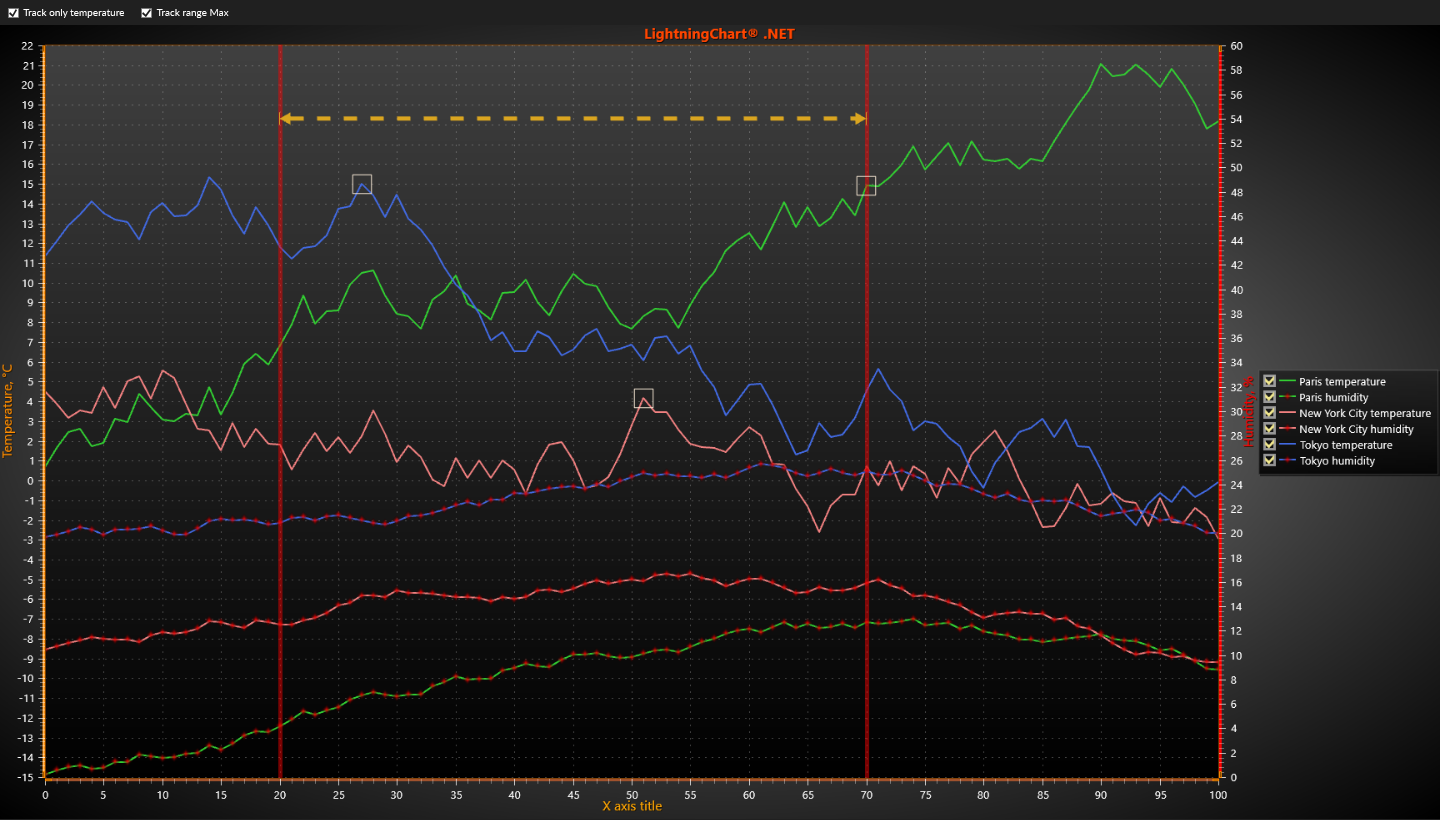 CursorAdvancedFeatures CursorAdvancedFeatures | Demo shows how to us LineSeriesCursor's features TrackLineSeries and SolveYValue. Set or clear the check-boxes to see the difference. Drag LineSeriesCursor to change the range. | 2DViewXYLineSeriesCursorCursorSolveYValueTraceTrackTrackLineSeriesPredicateFuncDelegateAnnotationYAxisAutoPlacement |
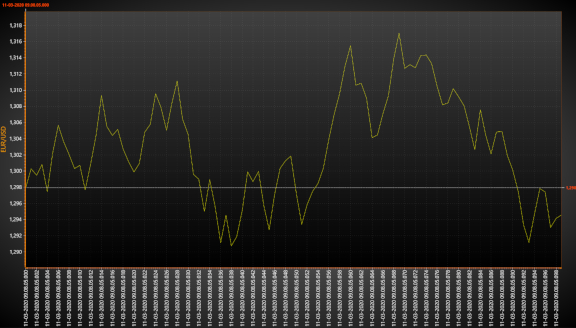 CursorProjectOnAxes CursorProjectOnAxes | Nearest data point to mouse solving and displaying the haircross values on axes. | 2DViewXYCartesianLineCursorSolveProjectionCustomaxistickTraceTrackMouseMVVM |
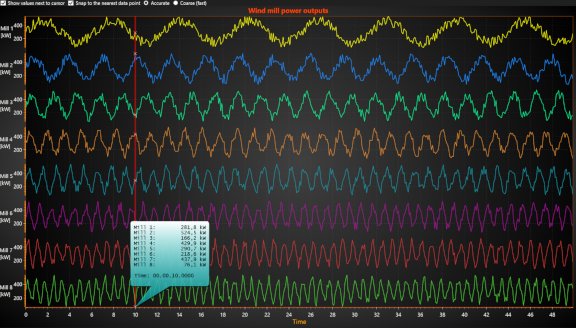 CursorTrackingXY CursorTrackingXY | Example of cursor tracking chart | 2DViewXYCartesianLineCursorAnnotationSolveTraceTrackMultiStackShowcaseMVVM |
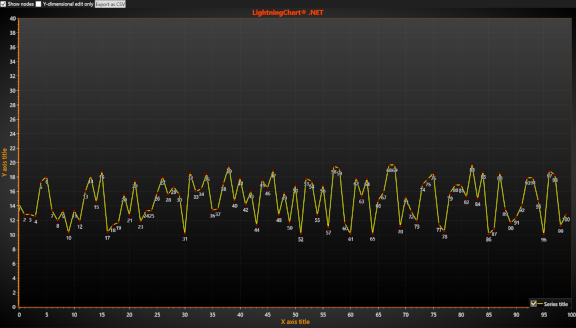 CurveNodeEdit CurveNodeEdit | This example shows you SeriesEventMarkers are used as movable node points. | 2DViewXYCartesianLineEditMouseMarkerFreeformMVVM |
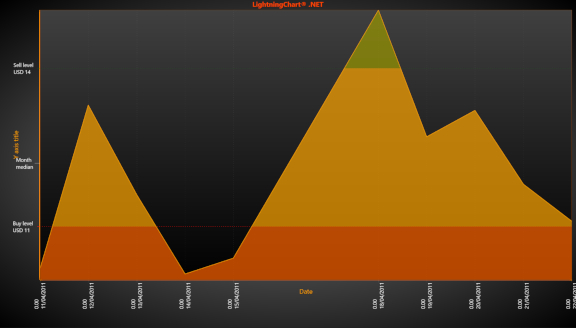 CustomAxisTicksXY CustomAxisTicksXY | Area chart with custom axis ticks. | 2DViewXYCartesianAxisTicksCustomticksCustomaxisticksMVVM |
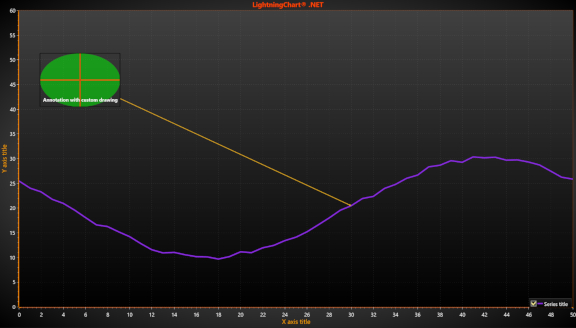 CustomRendering CustomRendering | ViewXY custom GDI rendering example. GDI rendering is made in annotation resize event handler, into annotation object's bitmap fill. | 2DViewXYCartesianAnnotationLineCustomRenderingGdiBitmapContextMVVM |
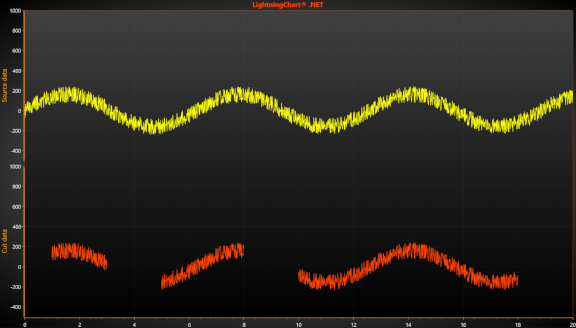 CutDataXY CutDataXY | Continuous data cut into separate series. The data itself stays in one series, and using several series is not required. | 2DBasicsViewXYCartesianCutGapsInvalidSegmentLineDataCursorMVVM |
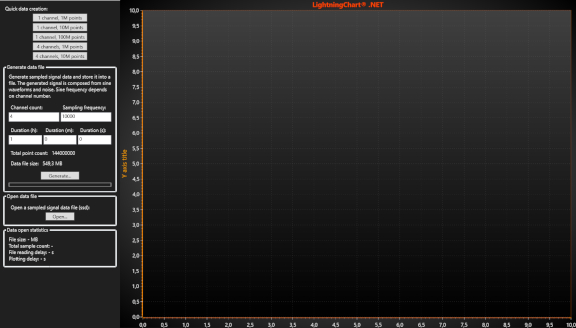 DataOpenTest DataOpenTest | Big data opening speed test. Measures accurately the time spent in plotting the data into the chart. | 2DViewXYCartesianOpenPerformanceSpeedTestFileReadingSampledataLineDelay |
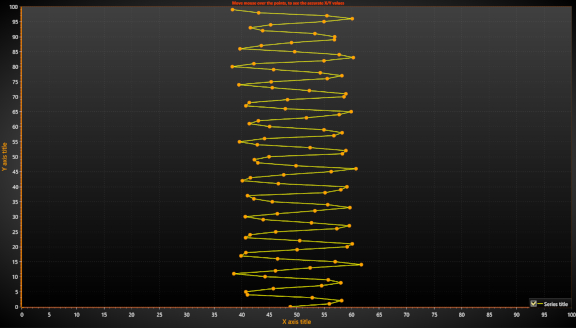 DataPointTracking DataPointTracking | This example shows you data tracking by mouse movingover line points. | 2DViewXYCartesianMarkerLineCursorSolveTraceTrackFreeformMouseMVVM |
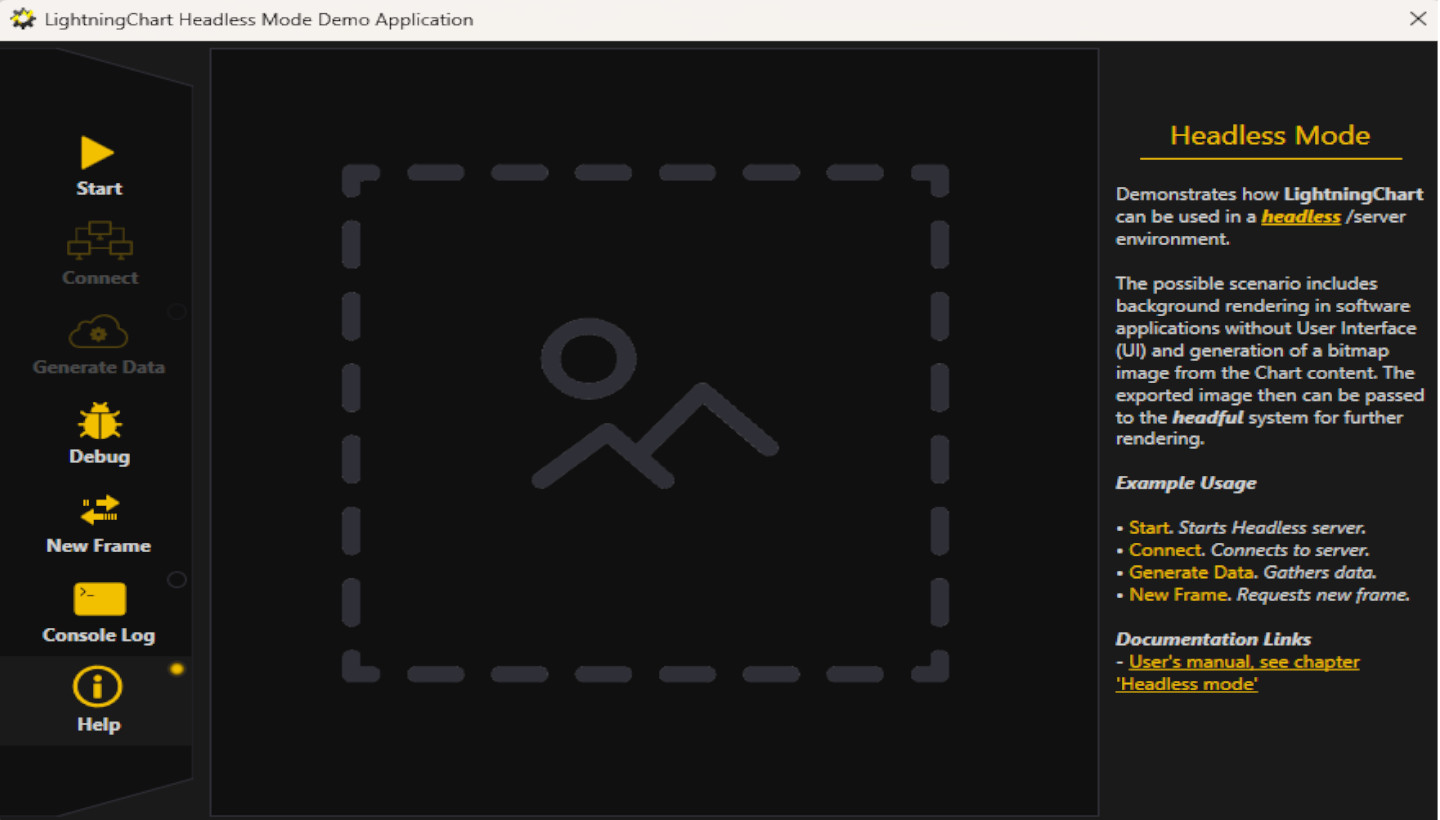 DemoService DemoService | The DemoService is an example of using LightningChart Headless mode. Headless mode is a software capability of working on a device without an access to a Graphical User Interface (GUI). Headless mode allows running LightningChart in a headless/server environment. Service server is a windows service, that is installed and started separately (copied by SDK installer). The server applications on the demo provide communication with the client using Windows named pipes. | HeadlessModeViewXYLineServiceServerStreamingStandaloneNewAdded |
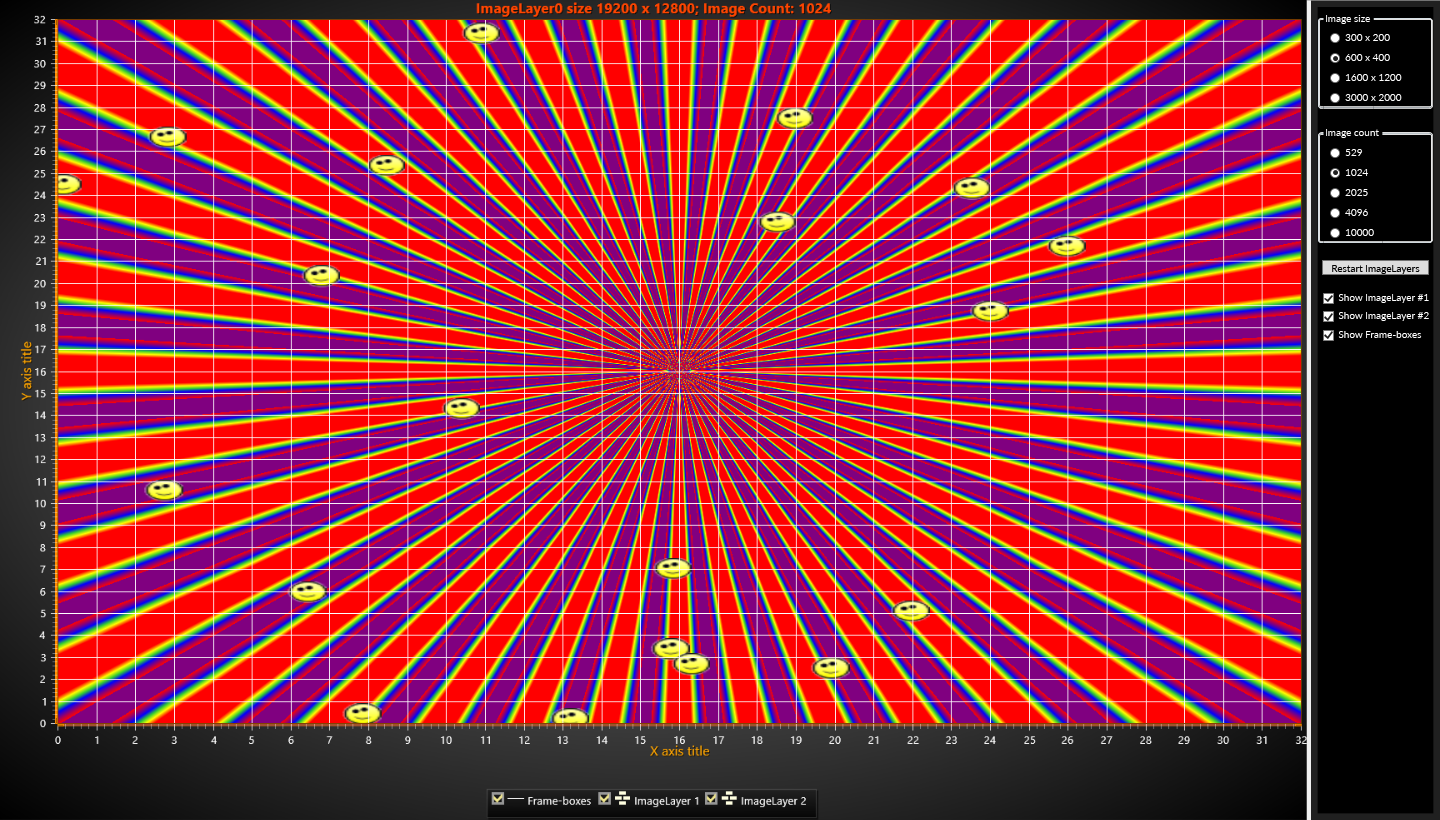 ImageLayer ImageLayer | Two image layers compound from many smaller bitmaps. In this example 2 ImageLayers in the background of XY chart. Each layer can contain multiple bitmaps, each of which location in ImageLayer defined by position and size parameters. On top of ImageLayer all ViewXY series can be rendered. | ViewXY2DImageLayerLayerImageDataBitmapImageLineCollectionSegmentLineThreadMemoryWaferSemiconductorsMEMSOptical |
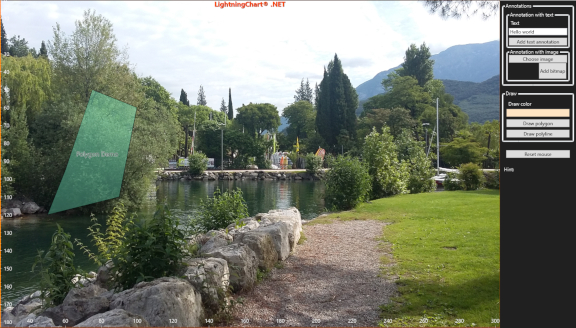 ImageViewer ImageViewer | Annotation filled high-resolution image with mouse-interactive modifications. Click on the image to draw controls: annotation with custom text or bitmap; polygons and polylines. | 2DViewXYAnnotationPolylinePolygonBitmapImageMVVM |
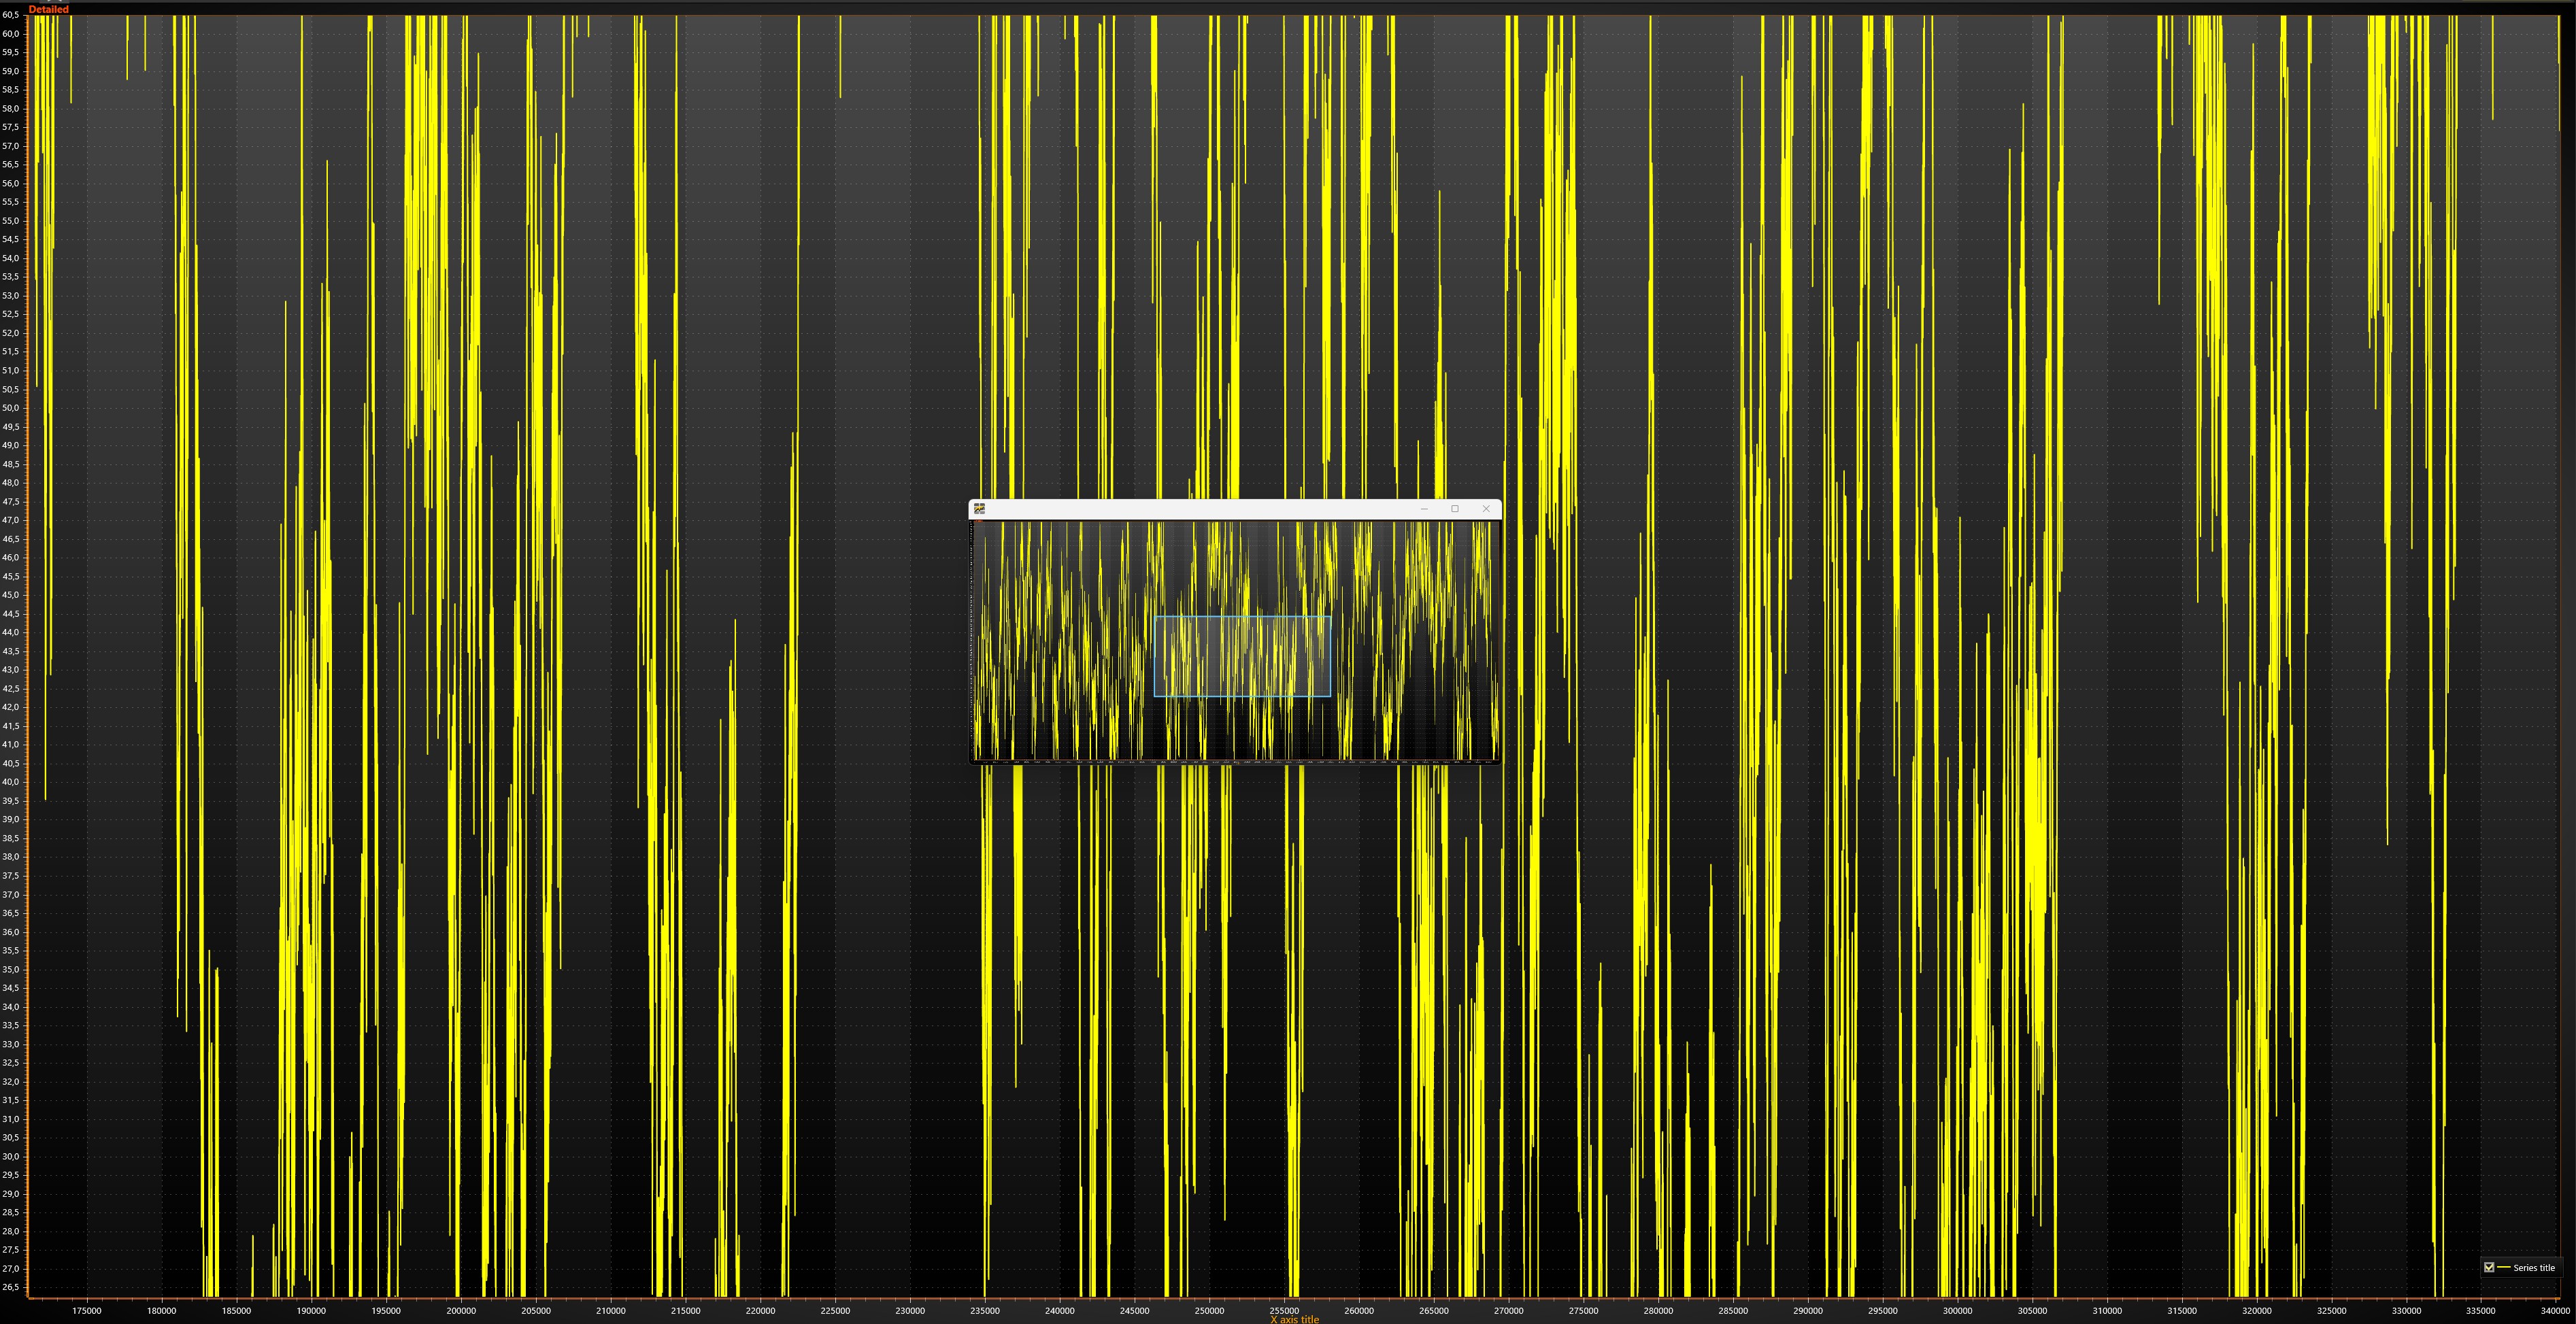 LiteZoomBar LiteZoomBar | LiteZoomBar is a custom XY chart, that can be used to get an overview of the whole dataset and to zoom the chart to specific areas. Example creates LiteZoomBar and adds it to another Window. LiteZoomBar has WinForms and (non-bindable) WPF editions. | 2DViewXYBasicLineZoomZoomBarRangeLiteZoomBarWindowMultipleWindows |
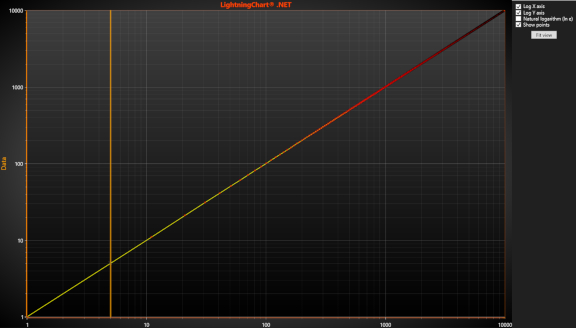 LogAxesXY LogAxesXY | Logarithmic axes example. | 2DViewXYPointLineSeriesLogLogarithmicLinearLineDataCursorAutoDivSpacingMajorDivMinorDivCountLineSeriesCursorLogBaseLogLabelsTypeCartesianMVVM |
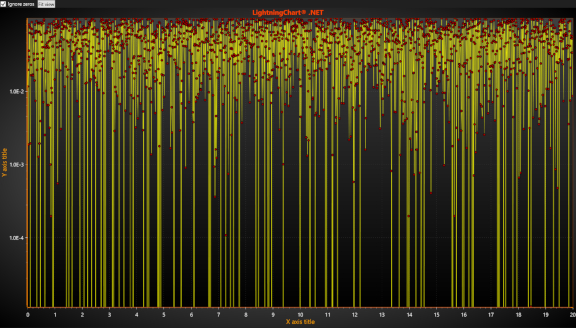 LogIgnoreZero LogIgnoreZero | This example shows you log axis ignore zero values example. Performs FitView ignoring the zero data values. If ignore is not used, chart fits the bottom limit to the LogZeroClamp value of Y-axis. | Basic2DViewXYLinePointLineSeriesLogLogarithmicLogZeroClampZeroIgnoreZerosInLogFitViewFitYMarginPixelsCartesianMVVM |
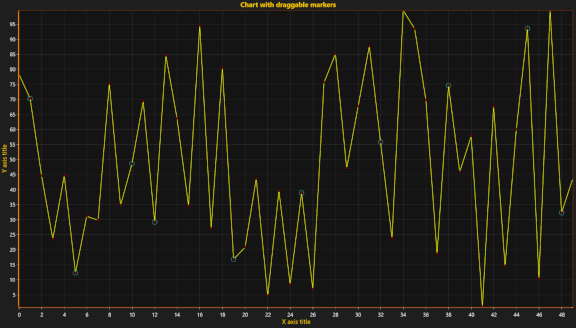 MarkersTracking MarkersTracking | Simple marker example. Markers can be dragged by mouse and they will snap to the closest point. | Basics2DViewXYLinePointLineSeriesTrackResolveMarkerSeriesEventMarkerIndicatorCartesianMVVM |
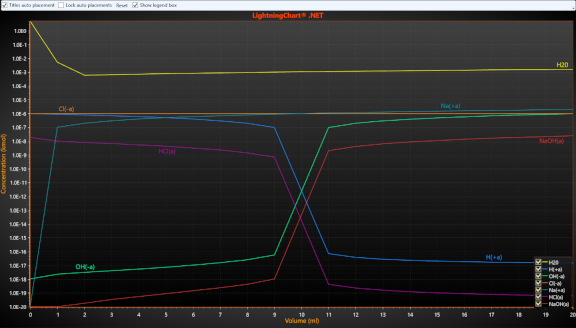 MinLog MinLog | This example shows you minimal logarithmic values near zero. Several FreeformPointLineSeries displaying chemical concentration data. Automatic title placement in use. | 2DViewXYLineLogLogarithmicZeroAutoPlacementTitlesAutoPlacementFreeformPointLineSeriesLockAutoPositionCartesianMVVM |
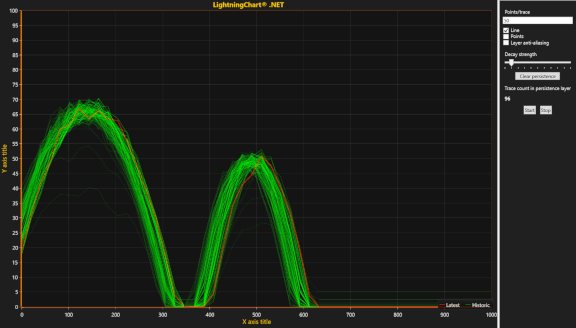 PersistentRenderingLayer PersistentRenderingLayer | Persistent series rendering layer example. Historic traces are rendered into persistent image layer. Each update round, the existing image is decayed by selected value. | 2DViewXYPersistentLayerRenderSeriesPersistenceLinePointsPointLineSeriesPersistentSeriesRenderingLayerCartesianMVVM |
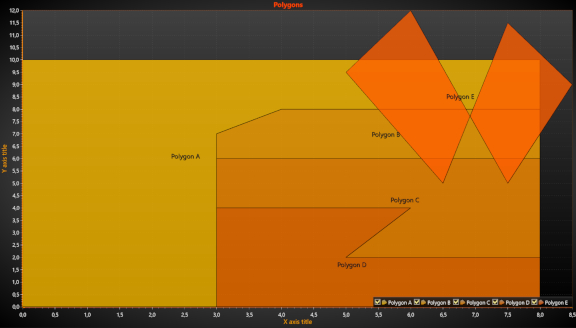 Polygon Polygon | Simple PolygonSeries demonstration. | Basics2DViewXYPolygonSeriesPathFillIntersectionsAllowedCartesianMVVM |
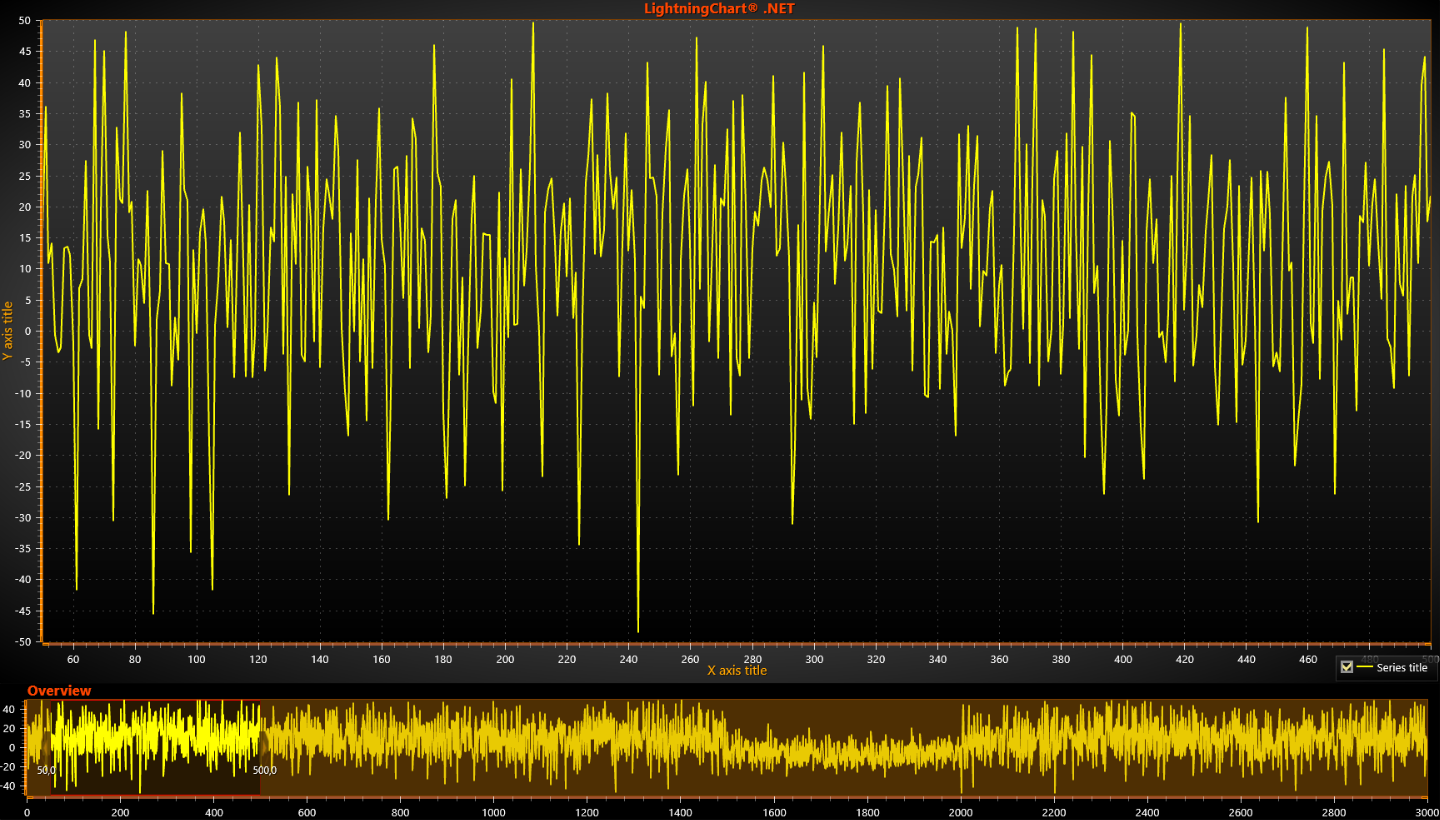 RealTimeZoomBar RealTimeZoomBar | Example shows how to create real time static length sample data series and update that continuously. ZoomBar chart is at the bottom, while chart with zoomed part of data is above. Drag and resize vertical band in ZoomBar chart to change zooming range. Zoom range can be changed in above chart with mouse as well. | Basic2DViewXYZoomBarSampleDataSeriesRealTimeStreaming |
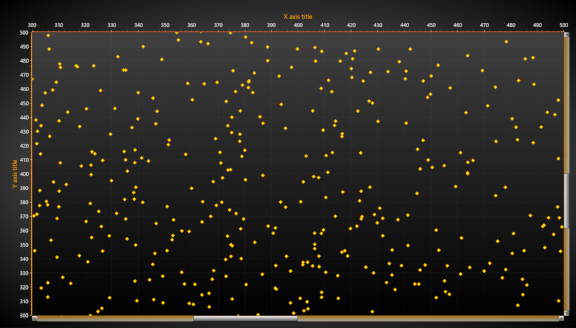 ScrollBars ScrollBars | In this example lots of scatter points in the view that can be panned using both horizontal and vertical scroll bar. | Basic2DViewXYScrollBarScatterScrollFreeformPointLineSeriesHorizontalVerticalMarginsCartesianMVVM |
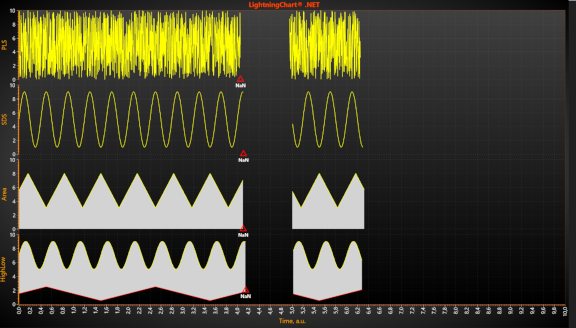 SeriesDataBreaking SeriesDataBreaking | Simple scrolling real-time monitor with multiple series and data breaking. | 2DViewXYDataBreakingBreakingRealtimeStreamingSweepingStackedMarkerSampleDataSeriesPointLineSeriesAreaSeriesHighLowSeriesAppendTimerNaNMVVM |
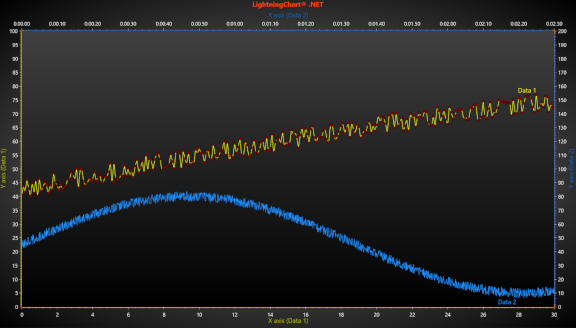 SeveralAxesXY SeveralAxesXY | Several X and Y axes. LightningChart allows using unlimited count of X and Y axes. Series can be attached to any of these. | Basic2DViewXYLinePointLineSeriesAxesMultiSeveralMVVMCartesian |
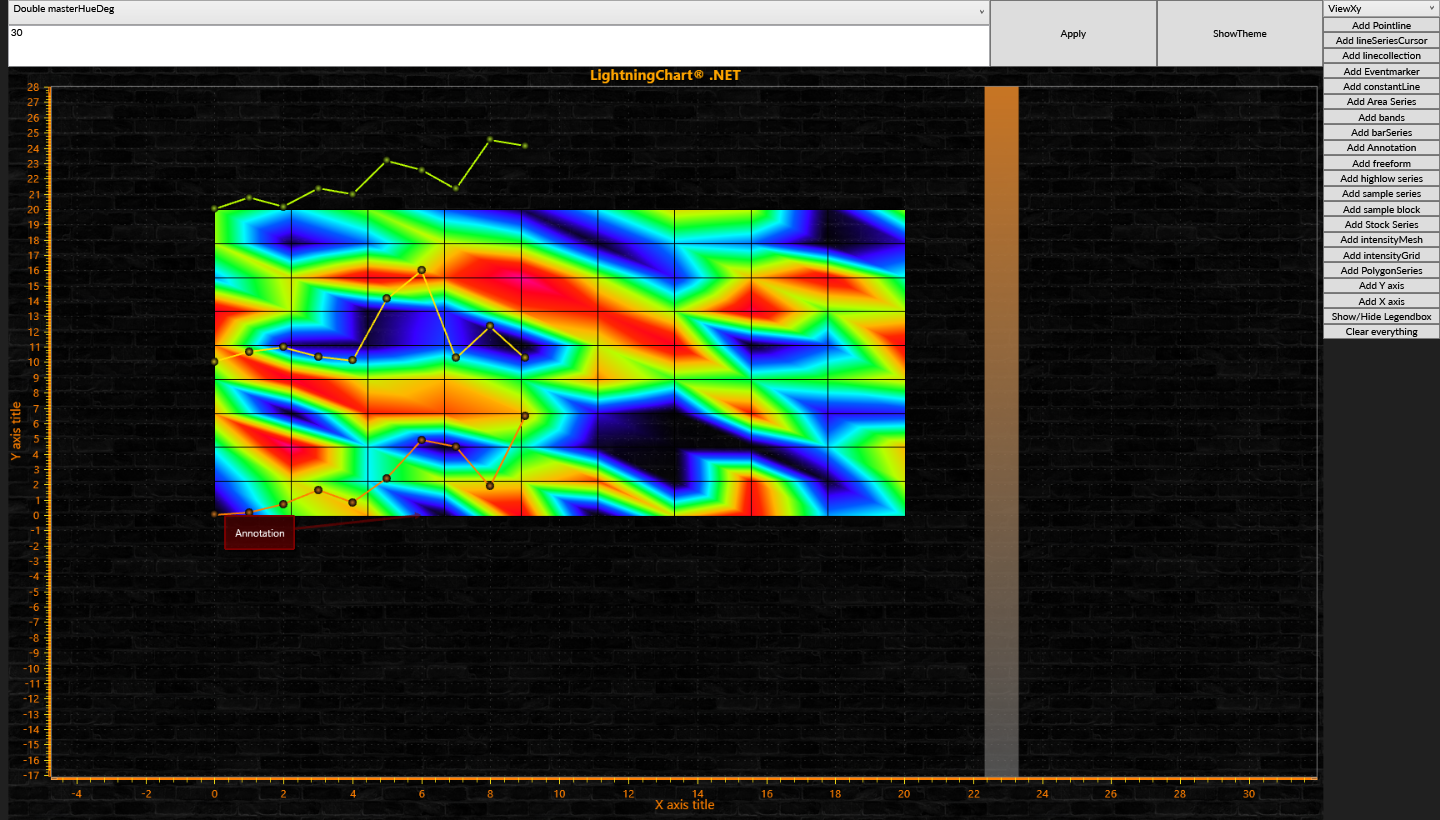 ThemeCreator ThemeCreator | Edit variables and test whats looks good for different series, try different backgrounds etc.. Pressing ShowTheme allows to see what needs to be changed to get same result in your own application. | ThemeCreator2DThemeThemeBasicsCustomDynamicThemeValueRangePaletteColorBackground |
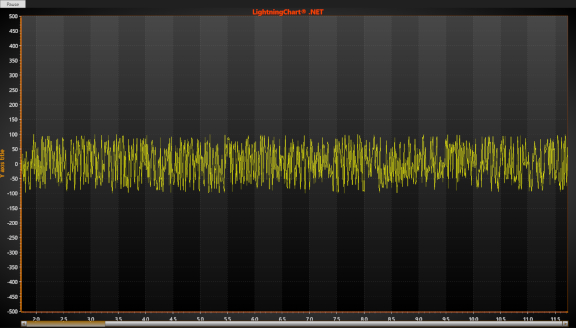 ThreadFedScrollBar ThreadFedScrollBar | This example shows you Historical (out-scrolled) data. Drag scroll bar to review old data while new data is processed in the background. Data is generated using a (non-UI) thread. | Advanced2DViewXYRealtimeStreamingScrollbarResumePauseScrollingSampleDataSeriesHistoryInvokeThreadReviewMVVMCartesian |
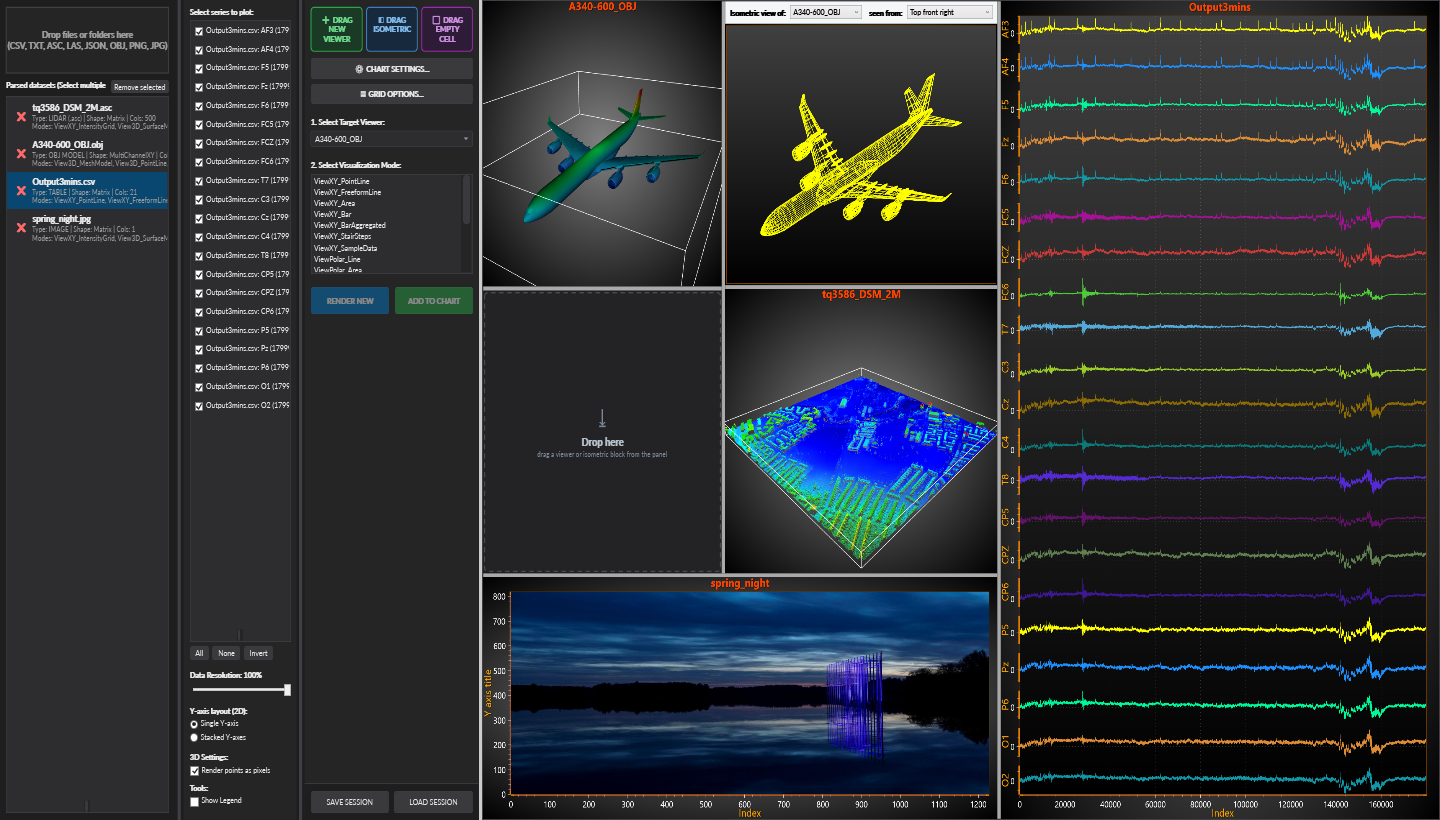 UniversalDataParser UniversalDataParser | This example shows a universal data parser that can load and visualize CSV, TXT, ASC, LAS, LAZ, and image data in multiple viewer types. It supports 2D, 3D, polar, LiDAR rendering, drag-and-drop viewer layout editing, and session save/load. Right-click a viewer to open its context menu and viewer options. For more information, see the [Universal Data Parser](https://lightningchart.com/net-charts/docs/inDetail/universal-data-parser/) page. | ShowcaseDashboard2D3DViewXYView3DPolarSurfaceLineScatterIntensityGridMeshModelAnnotationTableDataCursorLidarCSVFileParserInputDragDropLayoutSessionNewAdded |
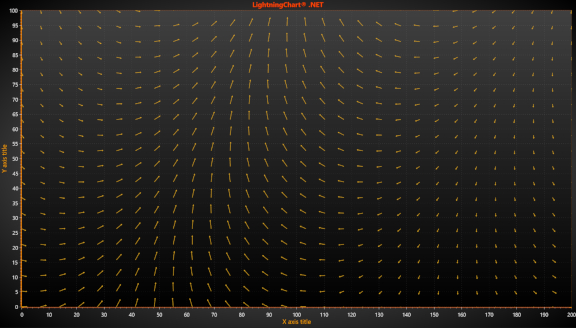 Vectors Vectors | Vectors example, implemented with Annotation objects. | 2DViewXYCartesianBasicVectorArrowAnnotationWindFieldMVVM |
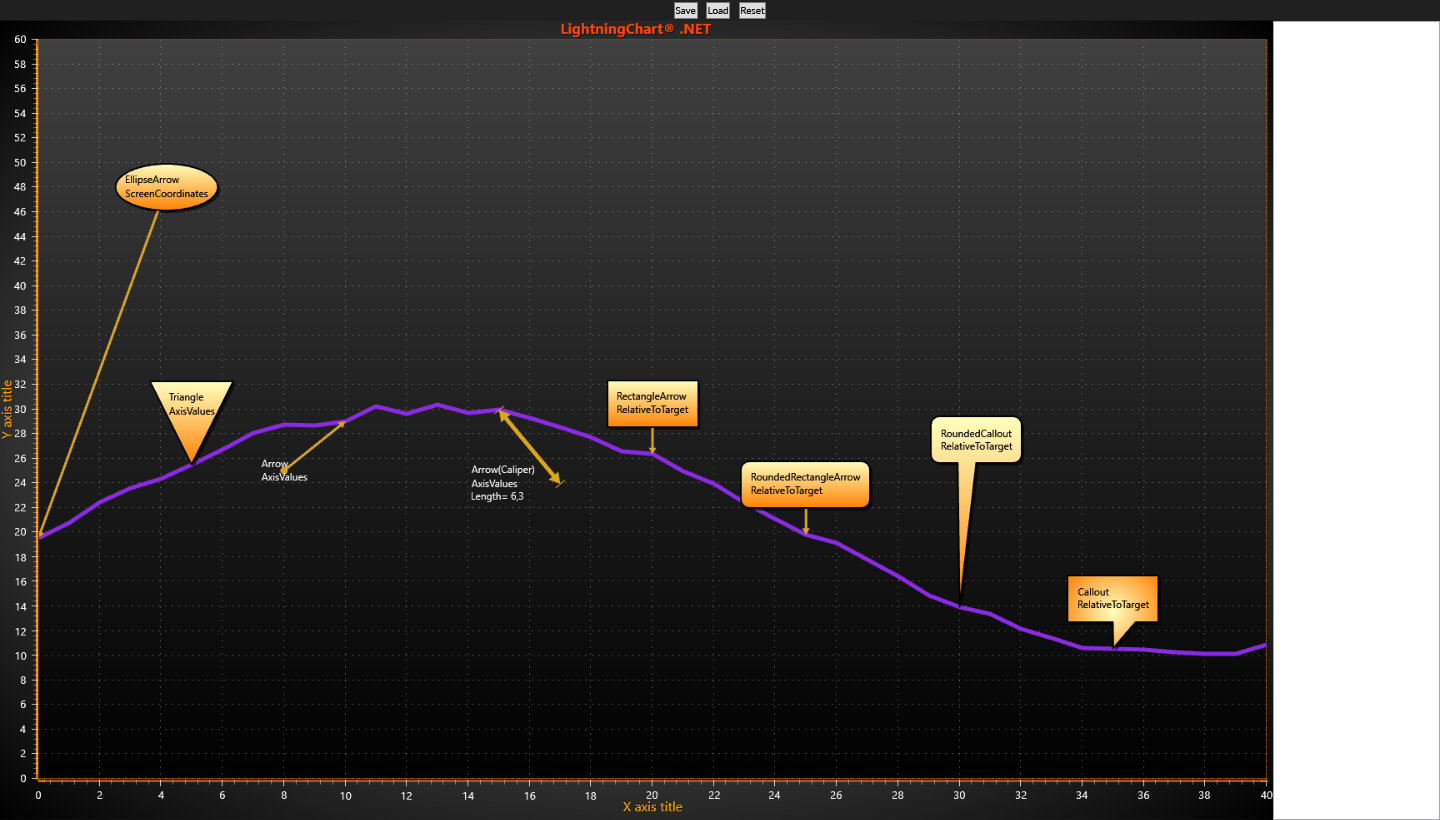 XamlSerialization XamlSerialization | Xaml serialization for AnnotationXY example . You can save chart state and load that state again, or reset Chart's state to initial (when example was loaded). | 2DViewXYCartesianAnnotationXamlXamlWriterXmlReaderSerializationLoadSave |
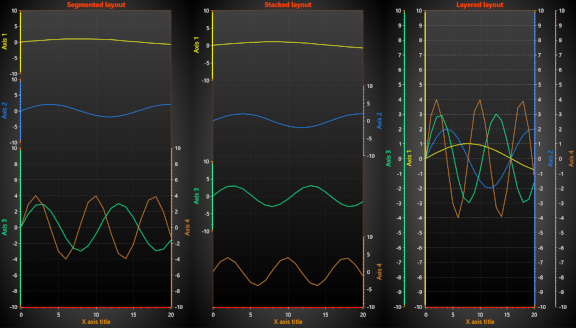 YAxesLayouts YAxesLayouts | Y axes layouts comparison (YAxesLayout). The graph can be set in Segmented, Stacked and Layered mode. Segmented layout gives greatest flexibility because several axes can be set in same segment and relative height for segment can be defined. | 2DBasicViewXYLayoutYAxesLayoutAxisLayoutStackedSegmentedLayeredMVVM |
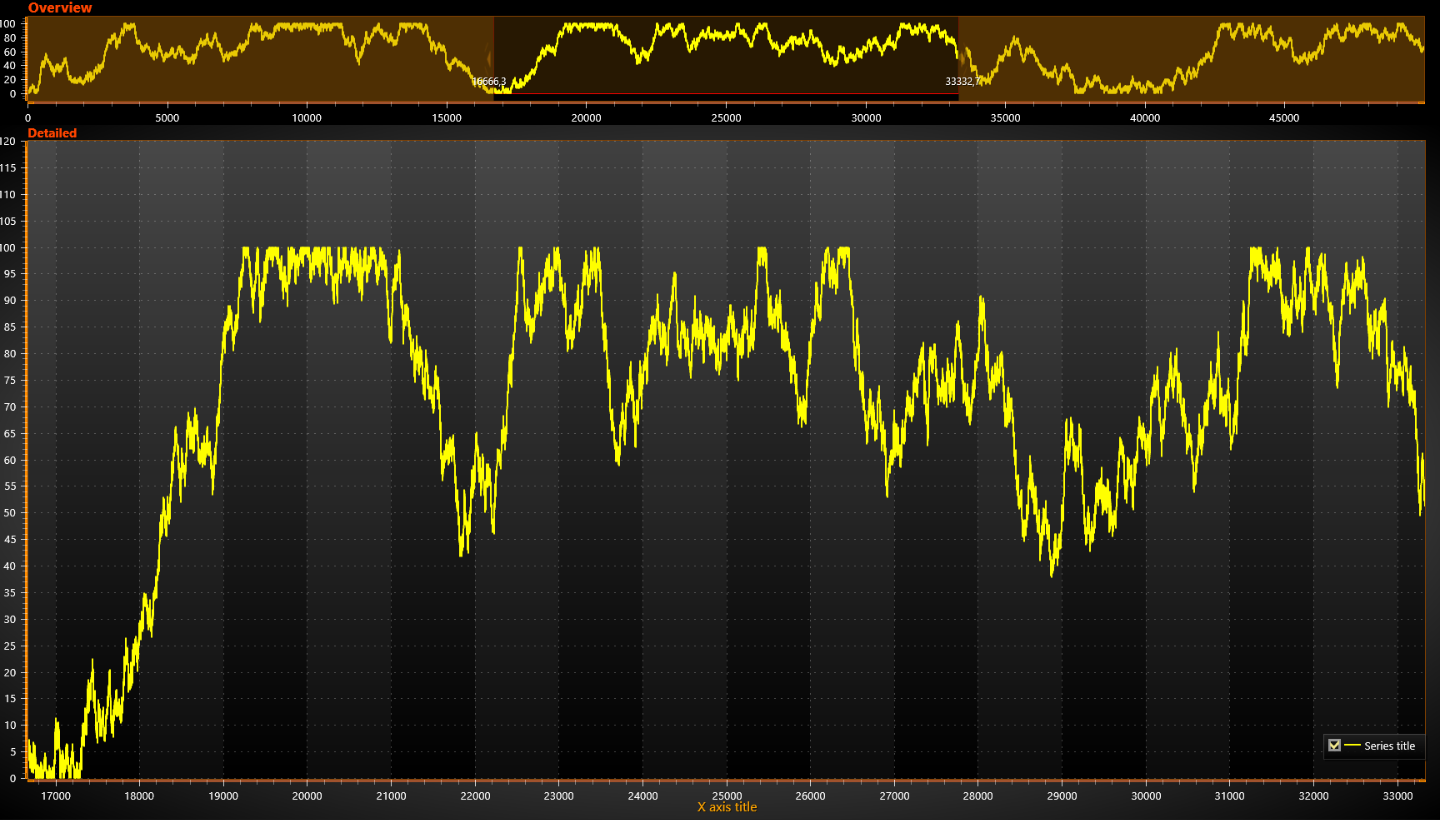 ZoomBar ZoomBar | Zoom bar is a custom XY chart, that can be used to get an overview of the whole dataset and to zoom the chart to specific areas. For WinForms and (non-bindable) WPF custom control ZoomBar is used. | 2DViewXYCartesianBasicLineBandZoomZoomBarRangeMVVM |